Question: Students will search the web for Procter & Gamble Financial Statements (Cash Flow Statement) Download Procter & Gamble (Cash Flow Statement). The Procter & Gamble
Students will search the web for Procter & Gamble Financial Statements (Cash Flow Statement) Download Procter & Gamble (Cash Flow Statement).
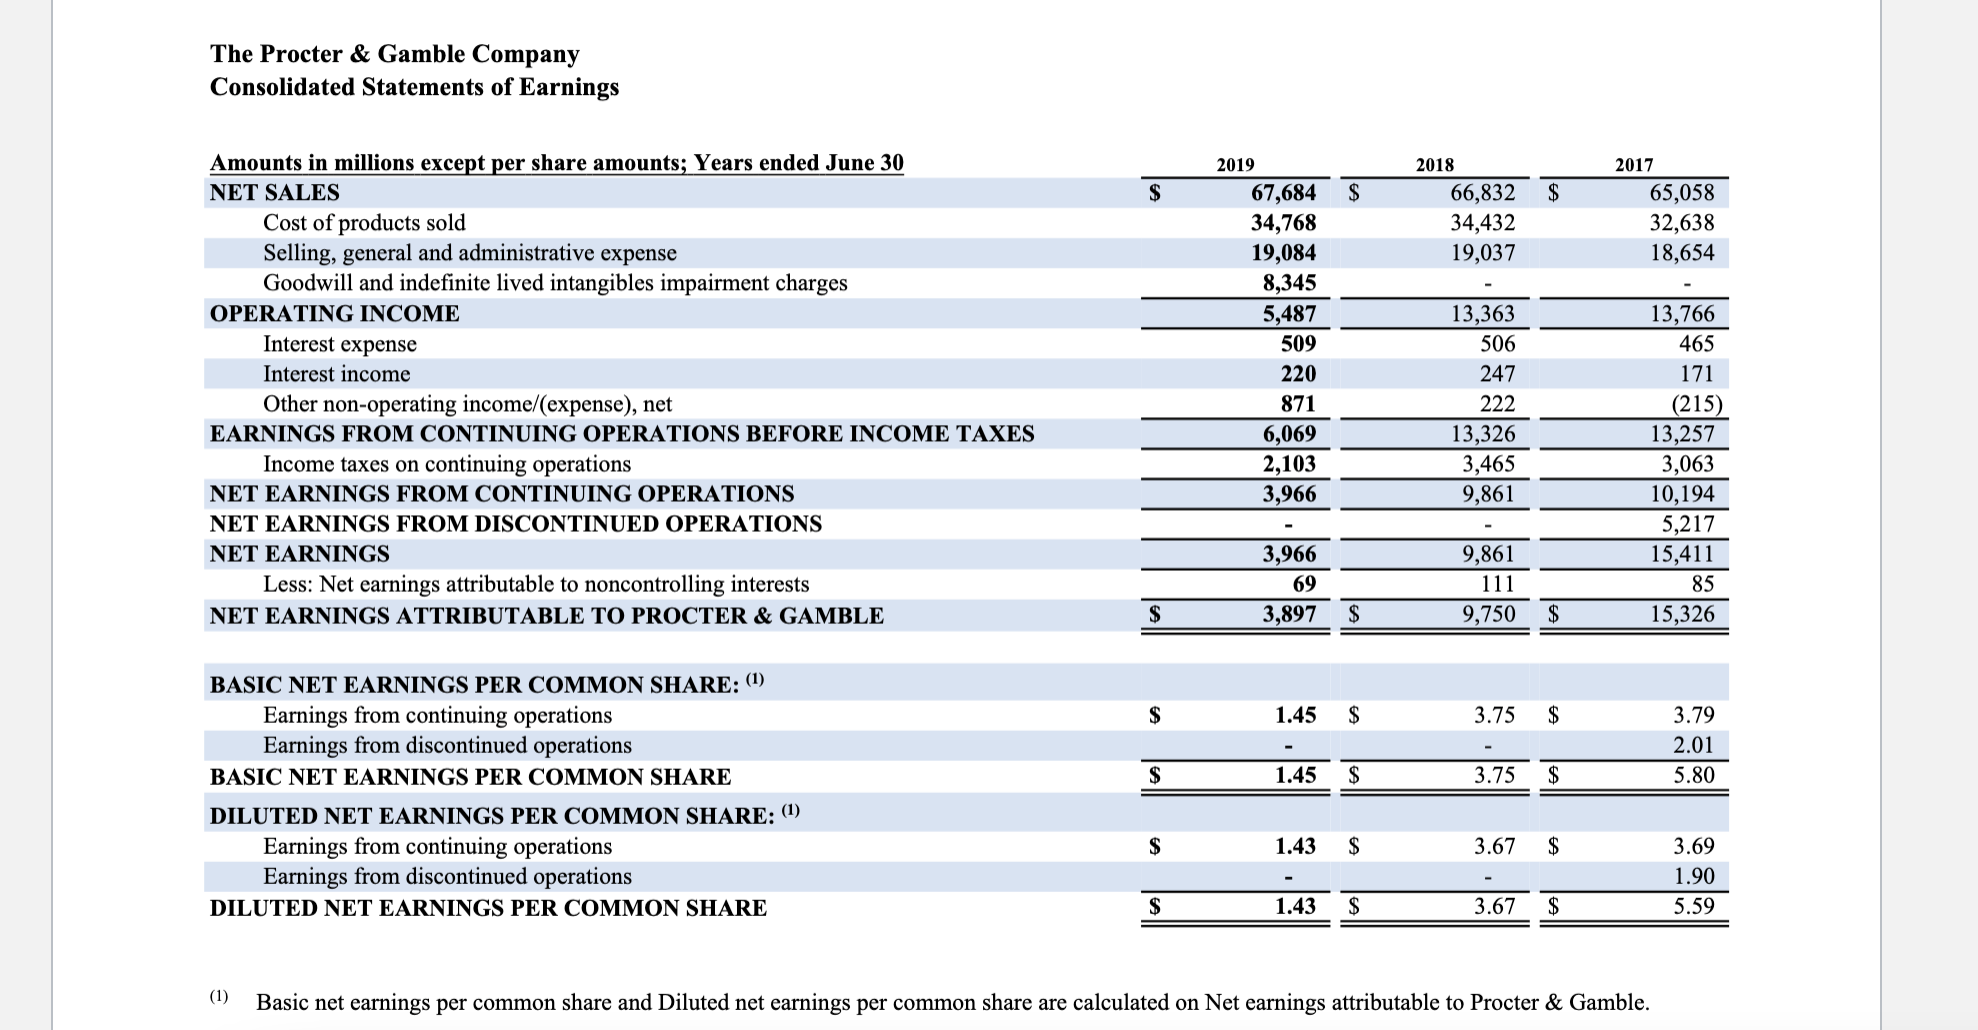
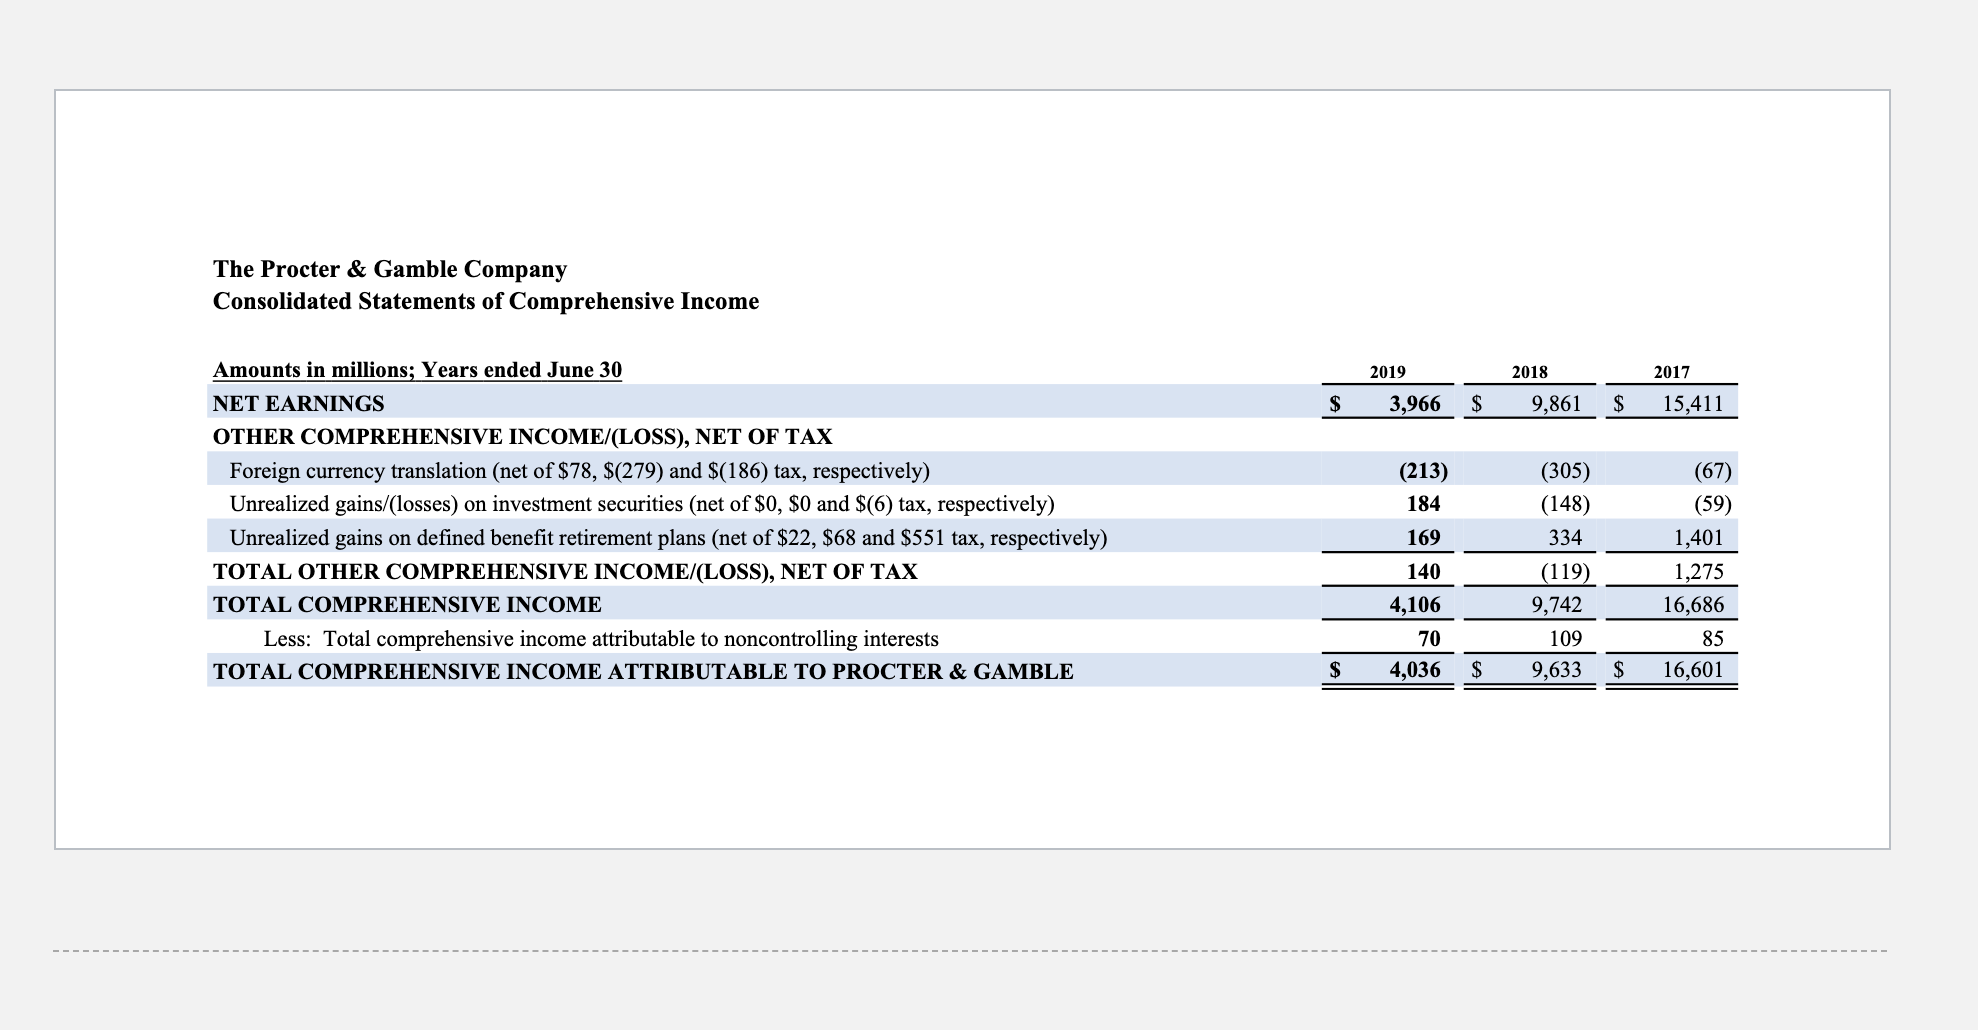
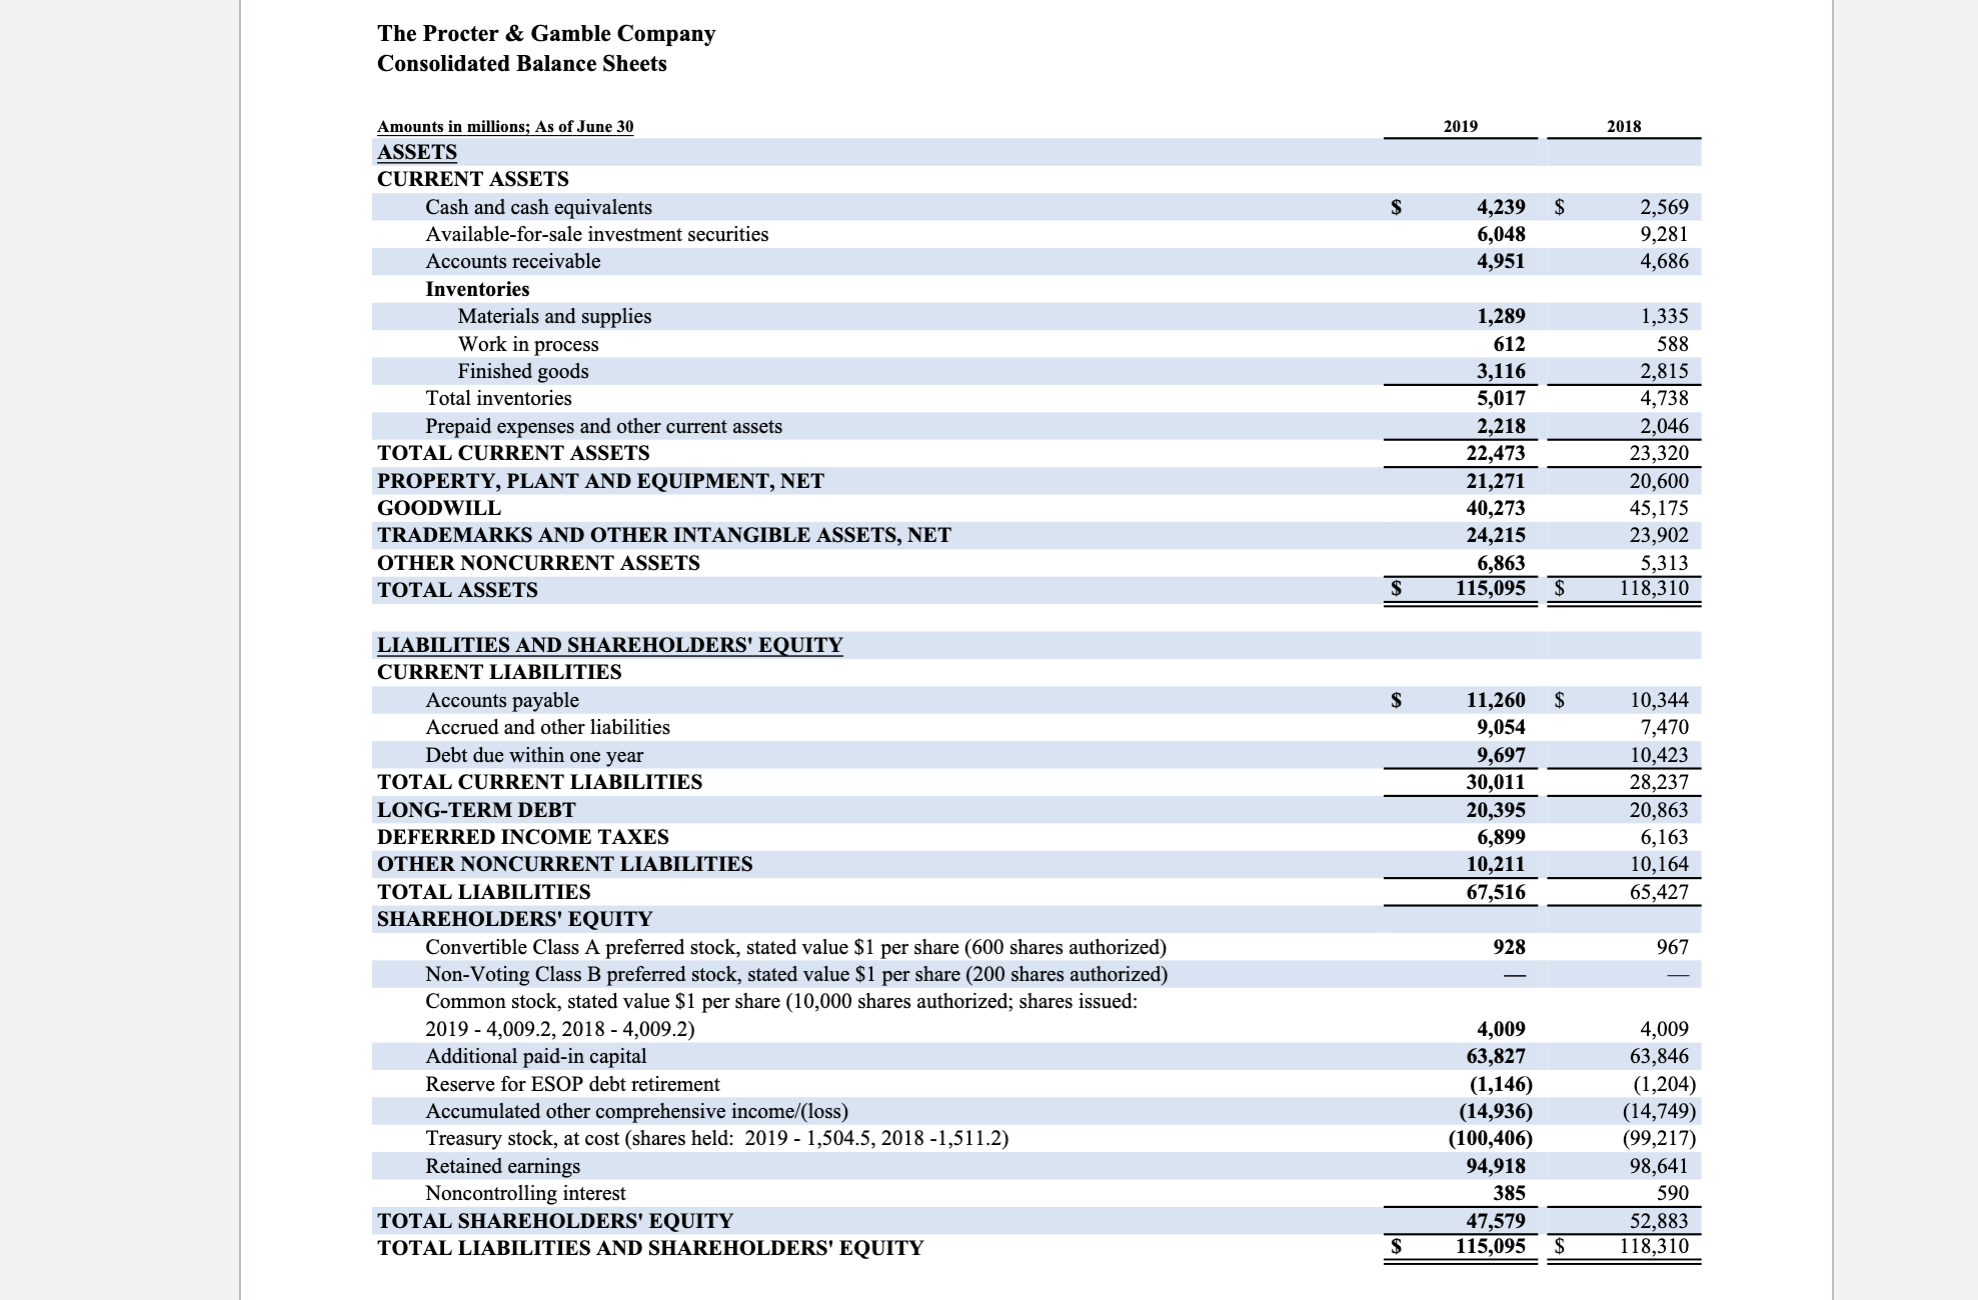
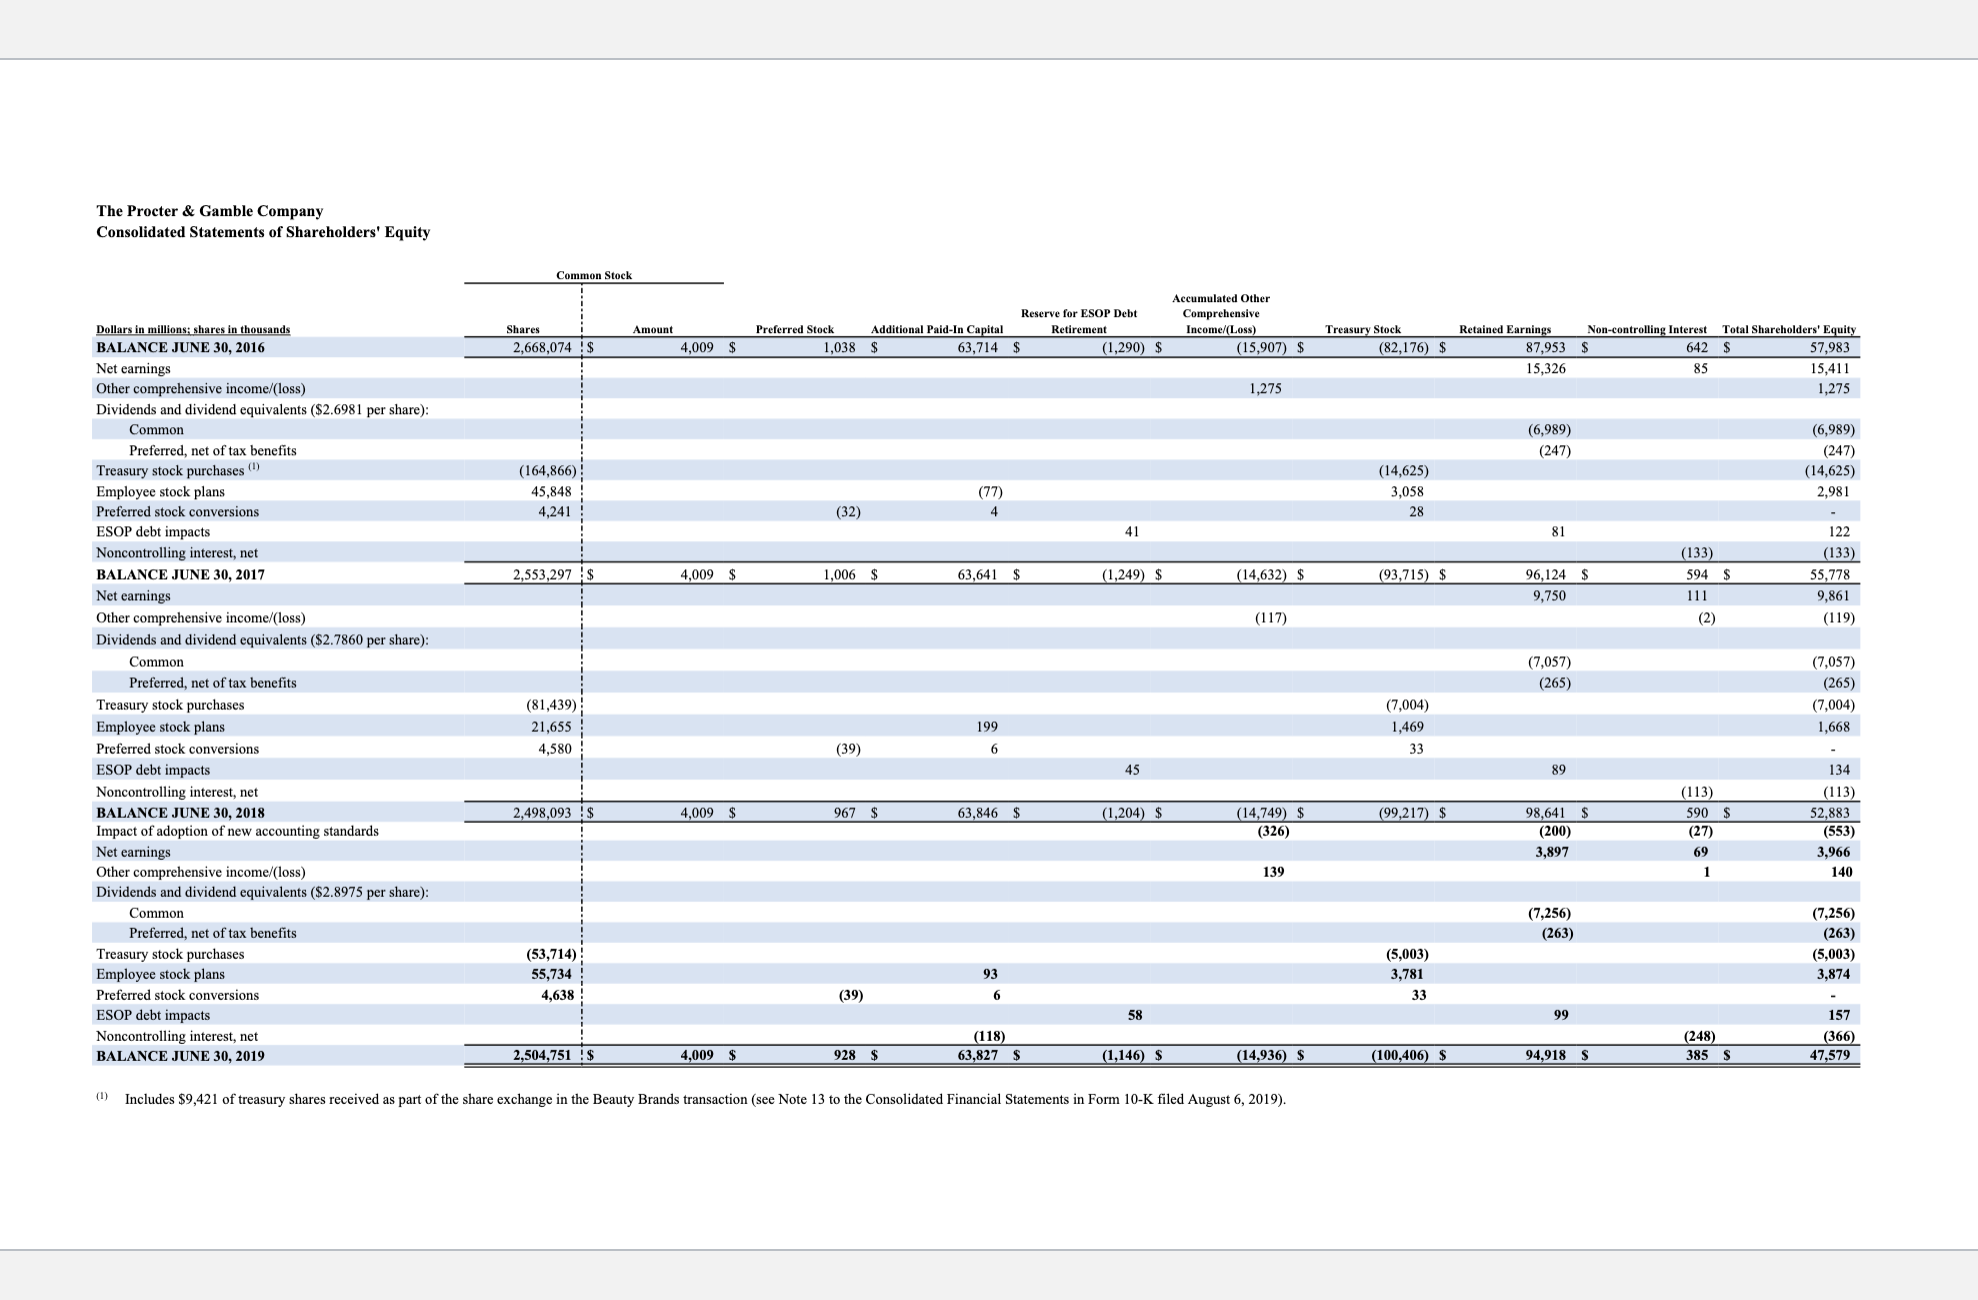
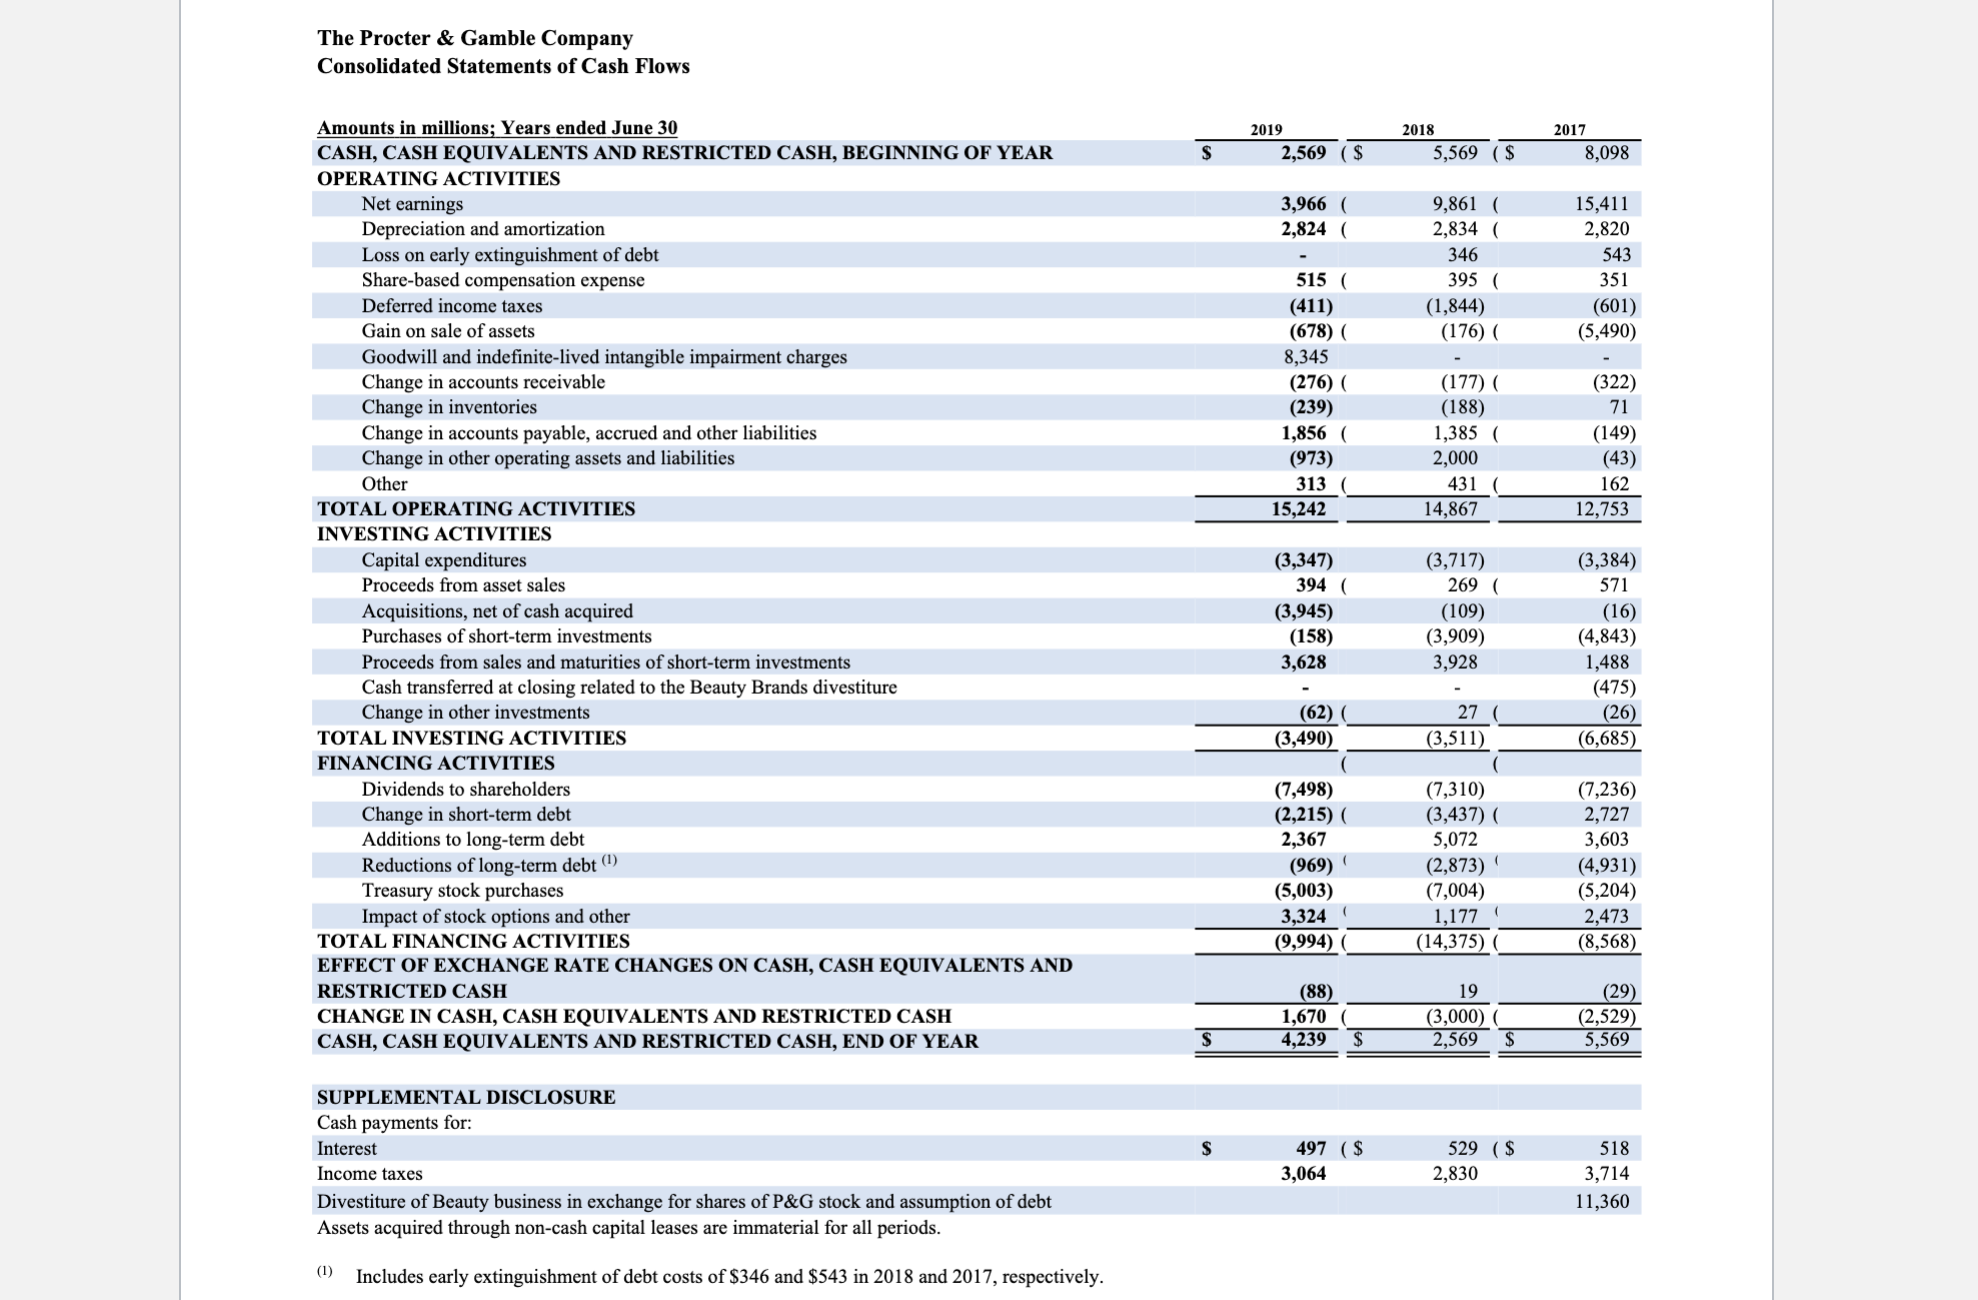
The Procter & Gamble Comp any Consolidated Statements of Earnings Amounts in millions exceptper share amounts; Years ended June 30 2019 2018 1017 NET SALES S 67,684 66,832 $ 65,058 Cost of products sold 34,768 34,432 32,638 Selling, general and administrative expense 19,084 19,037 18,654 Goodwill and indenite lived intangibles impairment charges 8,345 - OPERATING INCOME 5,487 13,363 13,766 Interest expense 509 506 465 Interest income 220 247 171 Other non-operating income/(expense), net 871 222 (215) EARNINGS FROM CONTINUING OPERATIONS BEFORE INCOME TAXES 6,069 13,326 13,257 Income taxes on continuing operations 2,103 3,465 3,063 NET EARNINGS FROM CONTINUING OPERATIONS 3,966 9,861 10,194 NET EARNINGS FROM DISCONTINUED OPERATIONS - - 5,217 NET EARNINGS 3,966 9,861 15,411 Less: Net earnings attributable to noncontrolling interests 69 111 85 NET EARNINGS ATTRIBUTABLE TO PROCTER & GAMBLE 5 3,897 9,750 S 15,326 BASIC NET EARNINGS PER COMMON SHARE: 1" Earnings from continuing operations $ 1.45 3.75 $ 3.79 Earnings 'om discontinued operations - - 2.01 BASIC NET EARNINGS PER COMMON SHARE 11% 1.45 3.75 $ 5.80 DILUTED NET EARNINGS PER COMMON SHARE: '1' Earnings from continuing operations 15 1.43 3.67 $ 3.69 Earnings from discontinued operations - - 1.90 DILUTED NET EARNINGS PER COMMON SHARE S 1.43 3.67 $ 5.59 (1) Basic net earnings per common share and Diluted net earnings per common share are calculated on Net earnings attributable to Procter & Gamble. The Procter & Gamble Company Consolidated Statements of Comprehensive Income Amounts in millions; Years ended June 30 2019 2018 2017 NET EARNINGS $ 3,966 $ 9,861 $ 15,411 OTHER COMPREHENSIVE INCOME/(LOSS), NET OF TAX Foreign currency translation (net of $78, $(279) and $(186) tax, respectively) (213) (305) (67) Unrealized gains/(losses) on investment securities (net of $0, $0 and $(6) tax, respectively) 184 (148) (59) Unrealized gains on defined benefit retirement plans (net of $22, $68 and $551 tax, respectively) 169 334 1,401 TOTAL OTHER COMPREHENSIVE INCOME/(LOSS), NET OF TAX 140 (119) 1,275 TOTAL COMPREHENSIVE INCOME 4,106 9,742 16,686 Less: Total comprehensive income attributable to noncontrolling interests 70 109 35 TOTAL COMPREHENSIVE INCOME ATTRIBUTABLE TO PROCTER & GAMBLE $ 4,036 $ 9,633 $ 16,601The Procter Br Gamble Company Consolidated Balance Sheets Amounts in millions; As of June 3|] 2019 2018 ASSETS CURRENT ASSETS Cash and cash equivalents 5 4,239 5 2,569 Available-forsale investment securities 6,048 9,281 Accounts receivable 4,951 4,686 Inventories Materials and supplies 1,289 1,335 Work in process 612 588 Finished goods 3,116 2,815 Total inventories 5,017 4,738 Prepaid expenses and other current assets 2,218 2,046 TOTAL CURRENT ASSETS 22,473 23,320 PROPERTY, PLANT AND EQUIPMENT, NET 21,271 20,600 GOODWILL 40,273 45,175 TRADEMARKS AND OTHER INTANGIBLE ASSETS, NET 24,215 23,902 OTHER NONCURRENT ASSETS 6,863 5,313 TOTAL ASSETS S 115,095 $ \"8,310 LIABILITIES AND SHAREHOLDERS' EQUITY CURRENT LIABILITIES Accounts payable 8 1 1,260 $ 10,344 Accrued and other liabilities 9,054 7,470 Debt due within one year 9,697 10,423 TOTAL CURRENT LIABILITIES 30,011 28,237 LONGTERM DEBT 20,395 20,863 DEFERRED INCOME TAXES 6,899 6,163 OTHER NONCURRENT LIABILITIES 10,211 10,164 TOTAL LIABILITIES 67,516 65,427 SHAREHOLDERS EQUITY Convertible Class A preferred stock, stated Value $1 per share (600 shares authorized) 928 967 Non-Voting Class B preferred stock, stated value $1 per share (200 shares authorized) 7 Common stock, stated value 31 per share (10,000 shares authorized; shares issued: 2019 - 4,009.2, 2018 - 4,009.2) 4,009 4,009 Additional paid-in capital 63,827 63,846 Reserve for ESOP debt retirement (1,146) (1,204) Accumulated other comprehensive income/(loss) (14,936) (14,749) Treasury stock, at cost (shares held: 2019 - 1,504.5, 2018 -l,511.2) (100,406) (99,217) Retained earnings 94,918 98,641 Noncontrolling interest 385 590 TOTAL SHAREHOLDERS' EQUITY 47,579 52,883 118,310 TOTAL LIABILITIES AND SHAREHOLDERS' EQUITY 5 5,095 The Procter & Gamble Company Consolidated Statements of Shareholders' Equity Common Stock Accumulated Other Reserve for ESOP Debt Comprehensive Dollars in millions; shares in thousands Shares Amount Preferred Stock Additional Paid-In Capital Retirement Income/(Loss) BALANCE JUNE 30, 2016 Treasury Stock 2,668,074 ! 4,009 $ Retained Earnings 1,038 $ Non-controlling Interest Total Shareholders' Equity 63,714 $ (1,290) (15,907) $ (82,176) $ 87,953 642 $ 57,983 Net earnings 15,326 85 15,411 Other comprehensive income/(loss) 1,275 1,275 Dividends and dividend equivalents ($2.6981 per share): Common (6,989) (6,989) Preferred, net of tax benefits (247) Treasury stock purchases (1) (164,866) (247) (14,625) 15,848 (14,625) Employee stock plans (77) 3,058 2,981 Preferred stock conversions 4,241 (32) 28 ESOP debt impacts 41 81 122 Noncontrolling interest, net (133) BALANCE JUNE 30, 2017 (133) 2,553,297 :$ 4,009 $ 1,006 $ 63,641 $ (1,249) (14,632) $ (93,715) $ 96,124 594 Net earnings 5,778 9,750 11 9.861 Other comprehensive income/(loss) (117) (2 ) (119) Dividends and dividend equivalents ($2.7860 per share): Common (7,057) (7,057) Preferred, net of tax benefits (265) (265) Treasury stock purchases (81,439) : (7,004) (7,004 Employee stock plans 21,655 199 1,469 1,668 Preferred stock conversions 4,580 (39) 6 33 ESOP debt impacts 45 89 134 Noncontrolling interest, net BALANCE JUNE 30, 2018 2,498,093 : $ (113) (113) 4,009 $ 967 $ 63,846 $ (1,204) $ (14,749) $ (99,217) $ 98,641 $ Impact of adoption of new accounting standards 590 $ 2,883 (326) (200) (27) (553) Net earnings 3,897 69 3.966 Other comprehensive income/(loss) 139 Dividends and dividend equivalents ($2.8975 per share): 140 Common (7,256) (7,256) Preferred, net of tax benefits (263) (263) Treasury stock purchases (53,714) (5,003) Employee stock plans $5,734 5,003 93 3,781 3.874 Preferred stock conversions 4,638 ! (39) 33 ESOP debt impacts 58 99 157 Noncontrolling interest, net (118) BALANCE JUNE 30, 2019 (248) (366) 2,504,751 ! $ 4,009 $ 928 $ 63,827 (1,146) (14,936) (100,406) $ 94,918 S 385 S 7,579 (1) Includes $9,421 of treasury shares received as part of the share exchange in the Beauty Brands transaction (see Note 13 to the Consolidated Financial Statements in Form 10-K filed August 6, 2019).The Procter & Gamble Company Consolidated Statements of Cash Flows Amounts in millions- Years ended June 30 CASH, CASH EQUIVALENTS AND RESTRICTED CASH, BEGINNING OF YEAR OPERATING ACTIVITIES Net earnings Depreciation and amortization Loss on early extinguishment of debt Share-based compensation expense Deferred income taxes Gain on sale of assets Goodwill and indenite-lived intangible impairment charges Change in accounts receivable Change in inventories Change in accounts payable, accrued and other liabilities Change in other operating assets and liabilities Other TOTAL OPERATING ACTIVITIES INVESTING ACTIVITIES Capital expenditures Proceeds from asset sales Acquisitions, net of cash acquired Purchases of short-tent) investments Proceeds from sales and maturities of short-term investments Cash transferred at closing related to the Beauty Brands divestiture Change in other investments TOTAL INVESTING ACTIVITIES FINANCING ACTIVITIES Dividends to shareholders Change in short-term debt Additions to longtcrrn debt Reductions oflong-term debt Treasury stock purchases Impact of stock options and other TOTAL FINANCING ACTIVITIES EFFECT OF EXCHANGE RATE CHANGES ON CASH, CASH EQUIVALENTS AND RESTRICTED CASH CHANGE IN CASH, CASH EQUIVALENTS AND RESTRICTED CASH CASH, CASH EQUIVALENTS AND RESTRICTED CASH, END OF YEAR (l) SUPPLEMENTAL DISCLOSURE Cash payments for: Interest Income taxes Divestiture of Beauty business in exchange for shares ofP&G stock and assumption of debt Assets acquired through non-cash capital leases are immaterial for all periods. (11 Includes early cxtinguishmcm of debt costs of $346 and $543 in 2018 and 2017, respectively. Ztll') lllll 2017 S 2.569 (S 5.569 (8 8,098 3,966 ( 9,861 ( 15,411 2,324 ( 2,834 ( 2,820 - 346 543 515 ( 39s ( 351 (411) (1,844) (601) (678) t (176) ( (5,490) 8,345 - . (276) 1 (177) t (322) (139) (188) 7] 1,856 ( 1,385 ( (149) (973) 2,000 (43) 313 1 431 1 162 15,242 14.867 12,753 (3,347) (3,717) (3,384) 394 ( 269 ( 571 (3,945) (109) (16) (158) (3.909) (4,843) 3,618 3,928 1,488 - - (475) (\")1 27 ( (26) (3,490) (3.51 1) (6,685) 1 ( (7,498) (7,310) (7,236) (2,215) ( (3,437) ( 2,727 2,367 5,072 3,603 (969) ' (2,873) ' (4,931) (5,003) (7,004) (5,204) 3,324 ' 1,177 ' 2,473 (9,994) ( (14,375) ( (8,568) (88) 19 (29) 1,670 ( (3,000)( (2,529) 5 4,239 3 2.569 1; 5,569 5 497 (s 529 (s 518 3,064 2,830 3,714 11,360 The Procter & Gamble Company Consolidated Statements of Cash Flows Cambio en el Flujo de Caja Amounts in millions; Years ended June 30 2019 2018 2017 2019 vs 2018 2018 vs 2017 SH, CASH EQUIVALENTS AND RESTRICTED CASH, BEGINNING OF YEAR S 2,569 ( $ 5, 569 ($ 8,098 (3,000) (2,529) # CASH, CASH EQUIVALENTS AND RESTRICTED CASH, OPERATING ACTIVITIES OPERATING ACTIVITIES Net earnings 3,966 ( 9,861 ( 15,411 Net earnings P&G Cambio en Actividades Operacionales Depreciation and amortization 2,824 ( 2.834 ( 2.820 Depreciation and amortization 2019 vs 2018 y 2018 vs 2017 Loss on early extinguishment of debt 346 543 Loss on early extinguishment of debt Share-based compensation expense 515 395 Share-based compensation expense Deferred income taxes (411) (1,844) (601) Deferred income taxes Gain on sale of assets (678) ( (176) (5,490) Gain on sale of assets Goodwill and indefinite-lived intangible impairment charges 8,345 Goodwill and indefinite-lived intangible impairment charges Change in accounts receivable (276) (177) ( (322) Change in accounts receivable Change in inventories (239) (188) 71 Change in inventories Change in accounts payable, accrued and other liabilities ,856 1,385 (149 ) Change in accounts payable, accrued and other liabilities Change in other operating assets and liabilities (973) 2,000 (43) Change in other operating assets and liabilities o o Other 313 431 162 12 Other TOTAL OPERATING ACTIVITIES 15,242 14,867 12,753 TOTAL OPERATING ACTIVITIES INVESTING ACTIVITIE INVESTING ACTIVITIES Capital expenditures (3,347) (3,717) (3,384) Capital expenditures 6 10 11 12 Proceeds from asset sales 394 269 571 Proceeds from ass t sales 2019 v5 2018 2018 vs 2017 Acquisitions, net of cash acquired 3,945 (109 ) Acquisitions, net of cash acquired Purchases of short-term investments (158) (3,909) 4,843 JOUAWN - Purchases of short-term investments Proceeds from sales and maturities of short-term investments 3,628 3.928 1.488 Proceeds from sales and maturities of short-term investments P&G Cambio en Actividades de Inversion Cash transferred at closing related to the Beauty Brands divestiture (475) Cash transferred at closing related to the Beauty Brands divestiture 2019 vs 2018 y 2018 vs 2017 Change in other investments (62 27 (26) Change in other investments TOTAL INVESTING ACTIVITIES (3,490) (3,511) (6,685) TOTAL INVESTING ACTIVITIES FINANCING ACTIVITIES FINANCING ACTIVITIES Dividends to shareholders (7,498 (7,310) (7,236) Dividends to shareholders Change in short-term debt (2,215) ( (3,437) ( 2,727 Change in short-term debt Additions to long-term debt 2.367 5,072 3,603 JAVAWN - Additions to long-term debt Reductions of long-term debt (1) (969) (2,873) (4,931) Reductions of long-term debt (1) Treasury stock purchases (5,003) (7,004) (5,204) Treasury stock purchases Impact of stock options and other 3,324 1,177 2,473 Impact of stock options and other TOTAL FINANCING ACTIVITIES (9.994 (14,375) (8,568) TOTAL FINANCING ACTIVITIES EFFECT OF EXCHANGE RATE CHANGES ON CASH, CASH EQUIVALENTS AND EFFECT OF EXCHANGE RATE CHANGES ON CASH, CASH RESTRICTED CASH (88) 19 (29) EQUIVALENTS AND RESTRICTED CASH CHANGE IN CASH, CASH EQUIVALENTS AND RESTRICTED CASH ,670( (3,000)( (2,529) CHANGE IN CASH, CASH EQUIVALENTS AND RESTRICTED CASH, CASH EQUIVALENTS AND RESTRICTED CASH, END OF YEAR 4,239 S 2,569 5.569 1,670 (3,000) CASH, CASH EQUIVALENTS AND RESTRICTED CASH, END 2019 vs 2018 2018 vs 2017 (3,000) (2,529) P&G Cambio en Actividades de Financiamiento 2019 vs 2018 y 2018 vs 2017 2019 vs 2018 2018 vs 2017
Step by Step Solution
There are 3 Steps involved in it
1 Expert Approved Answer
Step: 1 Unlock
Question Has Been Solved by an Expert!
Get step-by-step solutions from verified subject matter experts
Step: 2 Unlock
Step: 3 Unlock
Students Have Also Explored These Related Finance Questions!