

Question: Study Description A study was designed to examine why people differ in their assessments of the increasing wealth inequality within developed nations. Previous research reveals
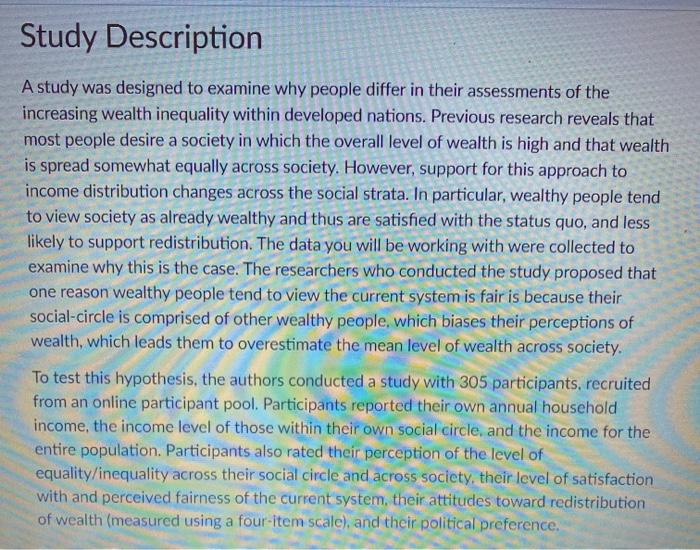
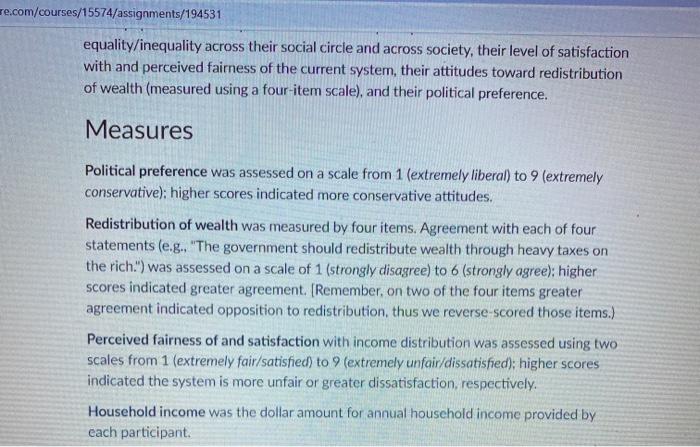
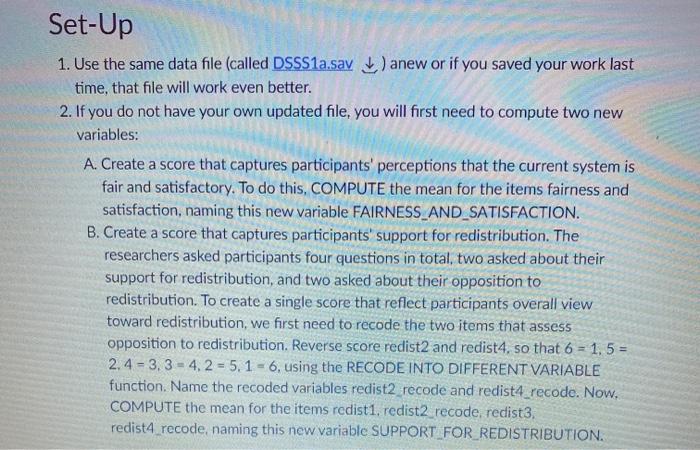
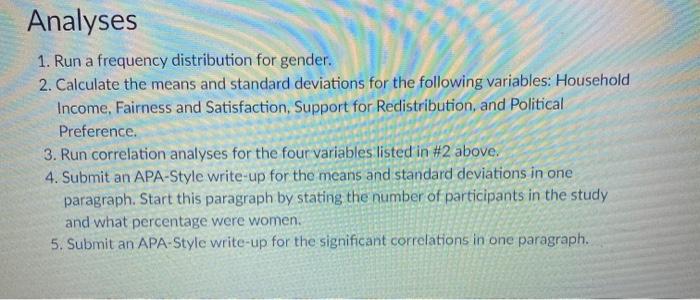
Study Description A study was designed to examine why people differ in their assessments of the increasing wealth inequality within developed nations. Previous research reveals that most people desire a society in which the overall level of wealth is high and that wealth is spread somewhat equally across society. However, support for this approach to income distribution changes across the social strata. In particular, wealthy people tend to view society as already wealthy and thus are satisfied with the status quo, and less likely to support redistribution. The data you will be working with were collected to examine why this is the case. The researchers who conducted the study proposed that one reason wealthy people tend to view the current system is fair is because their social-circle is comprised of other wealthy people, which biases their perceptions of wealth, which leads them to overestimate the mean level of wealth across society. To test this hypothesis, the authors conducted a study with 305 participants, recruited from an online participant pool. Participants reported their own annual household income, the income level of those within their own social circle, and the income for the entire population. Participants also rated their perception of the level of equality/inequality across their social circle and across society, their level of satisfaction with and perceived fairness of the current system, their attitudes toward redistribution of wealth (measured using a four-item scale), and their political preference. re.com/courses/15574/assignments/194531 equality/inequality across their social circle and across society, their level of satisfaction with and perceived fairness of the current system, their attitudes toward redistribution of wealth (measured using a four-item scale), and their political preference. Measures Political preference was assessed on a scale from 1 (extremely liberal) to 9 (extremely conservative): higher scores indicated more conservative attitudes. Redistribution of wealth was measured by four items. Agreement with each of four statements (e.g. "The government should redistribute wealth through heavy taxes on the rich.") was assessed on a scale of 1 (strongly disagree) to 6 (strongly agree): higher scores indicated greater agreement. (Remember, on two of the four items greater agreement indicated opposition to redistribution, thus we reverse scored those items.) Perceived fairness of and satisfaction with income distribution was assessed using two scales from 1 (extremely fair/satisfied) to 9 (extremely unfair dissatisfied); higher scores indicated the system is more unfair or greater dissatisfaction, respectively. Household income was the dollar amount for annual household income provided by each participant Set-Up 1. Use the same data file (called DSSS1a.sav ) anew or if you saved your work last time, that file will work even better. 2. If you do not have your own updated file, you will first need to compute two new variables: A. Create a score that captures participants' perceptions that the current system is fair and satisfactory. To do this, COMPUTE the mean for the items fairness and satisfaction, naming this new variable FAIRNESS AND_SATISFACTION. B. Create a score that captures participants' support for redistribution. The researchers asked participants four questions in total, two asked about their support for redistribution, and two asked about their opposition to redistribution. To create a single score that reflect participants overall view toward redistribution, we first need to recode the two items that assess opposition to redistribution. Reverse score redist2 and redist4, so that 6 = 1.5 = 2.4 -3.3 = 4,2 - 5.1 - 6, using the RECODE INTO DIFFERENT VARIABLE function. Name the recoded variables redist2_recode and redist4_recode. Now. COMPUTE the mean for the items redist1, redist2_recode, redist3. redist4_recode naming this new variable SUPPORT FOR_REDISTRIBUTION. Analyses 1. Run a frequency distribution for gender. 2. Calculate the means and standard deviations for the following variables: Household Income, Fairness and Satisfaction, Support for Redistribution, and Political Preference. 3. Run correlation analyses for the four variables listed in #2 above. 4. Submit an APA-Style write-up for the means and standard deviations in one paragraph. Start this paragraph by stating the number of participants in the study and what percentage were women. 5. Submit an APA-Style write-up for the significant correlations in one paragraph. Study Description A study was designed to examine why people differ in their assessments of the increasing wealth inequality within developed nations. Previous research reveals that most people desire a society in which the overall level of wealth is high and that wealth is spread somewhat equally across society. However, support for this approach to income distribution changes across the social strata. In particular, wealthy people tend to view society as already wealthy and thus are satisfied with the status quo, and less likely to support redistribution. The data you will be working with were collected to examine why this is the case. The researchers who conducted the study proposed that one reason wealthy people tend to view the current system is fair is because their social-circle is comprised of other wealthy people, which biases their perceptions of wealth, which leads them to overestimate the mean level of wealth across society. To test this hypothesis, the authors conducted a study with 305 participants, recruited from an online participant pool. Participants reported their own annual household income, the income level of those within their own social circle, and the income for the entire population. Participants also rated their perception of the level of equality/inequality across their social circle and across society, their level of satisfaction with and perceived fairness of the current system, their attitudes toward redistribution of wealth (measured using a four-item scale), and their political preference. re.com/courses/15574/assignments/194531 equality/inequality across their social circle and across society, their level of satisfaction with and perceived fairness of the current system, their attitudes toward redistribution of wealth (measured using a four-item scale), and their political preference. Measures Political preference was assessed on a scale from 1 (extremely liberal) to 9 (extremely conservative): higher scores indicated more conservative attitudes. Redistribution of wealth was measured by four items. Agreement with each of four statements (e.g. "The government should redistribute wealth through heavy taxes on the rich.") was assessed on a scale of 1 (strongly disagree) to 6 (strongly agree): higher scores indicated greater agreement. (Remember, on two of the four items greater agreement indicated opposition to redistribution, thus we reverse scored those items.) Perceived fairness of and satisfaction with income distribution was assessed using two scales from 1 (extremely fair/satisfied) to 9 (extremely unfair dissatisfied); higher scores indicated the system is more unfair or greater dissatisfaction, respectively. Household income was the dollar amount for annual household income provided by each participant Set-Up 1. Use the same data file (called DSSS1a.sav ) anew or if you saved your work last time, that file will work even better. 2. If you do not have your own updated file, you will first need to compute two new variables: A. Create a score that captures participants' perceptions that the current system is fair and satisfactory. To do this, COMPUTE the mean for the items fairness and satisfaction, naming this new variable FAIRNESS AND_SATISFACTION. B. Create a score that captures participants' support for redistribution. The researchers asked participants four questions in total, two asked about their support for redistribution, and two asked about their opposition to redistribution. To create a single score that reflect participants overall view toward redistribution, we first need to recode the two items that assess opposition to redistribution. Reverse score redist2 and redist4, so that 6 = 1.5 = 2.4 -3.3 = 4,2 - 5.1 - 6, using the RECODE INTO DIFFERENT VARIABLE function. Name the recoded variables redist2_recode and redist4_recode. Now. COMPUTE the mean for the items redist1, redist2_recode, redist3. redist4_recode naming this new variable SUPPORT FOR_REDISTRIBUTION. Analyses 1. Run a frequency distribution for gender. 2. Calculate the means and standard deviations for the following variables: Household Income, Fairness and Satisfaction, Support for Redistribution, and Political Preference. 3. Run correlation analyses for the four variables listed in #2 above. 4. Submit an APA-Style write-up for the means and standard deviations in one paragraph. Start this paragraph by stating the number of participants in the study and what percentage were women. 5. Submit an APA-Style write-up for the significant correlations in one paragraph
Step by Step Solution
There are 3 Steps involved in it

Get step-by-step solutions from verified subject matter experts