

Question: Study the charts below and conduct the required technical analysis. 2 . Look at the following charts and conduct a technical analysis of the financial
Study the charts below and conduct the required technical analysis.
Look at the following charts and conduct a technical analysis of the financial instruments reflected:
Compare charts and classify them as a fundamental or Technical Analysis?
Chart is a technical analysis. What technical aspects does it study? As an investor what would you conclude from this chart?
Describe chart from a technical analysis perspective. If you were an investor what would you read from this chart?
Would you say chart is a technical or a fundamental analysis? Give reasons for your answer?
Examine all four charts and document your observations and your understanding of reading charts.
Technical Charts for Microsoft shares.
Provide technical analysis charts for Microsoft Shares from
Provide a commentary on what the charts tell you about the shares:
Has the price of the shares gone up or down?
How often during this period have shareholders been paid dividends?
When, during the period being studied would you have recommended to a client to buy Shares and when would you have discouraged it and why?
Compare chart that reflects Apple shares with Microsoft shares? Reflect on what you see conveyed in the charts?
Find text or tools
To print: Select File and then Print in your browser pulldown menus.
volvae
OtigCharty con
MACD MACD EMA Divergence
Chart
Find text or tools
cor
Silicon Alley Insider Chart of the Day
Apple Stock Performance Since The Release of The iPhone
$
Chart
Siticon Alley Insider
Chart of the Day
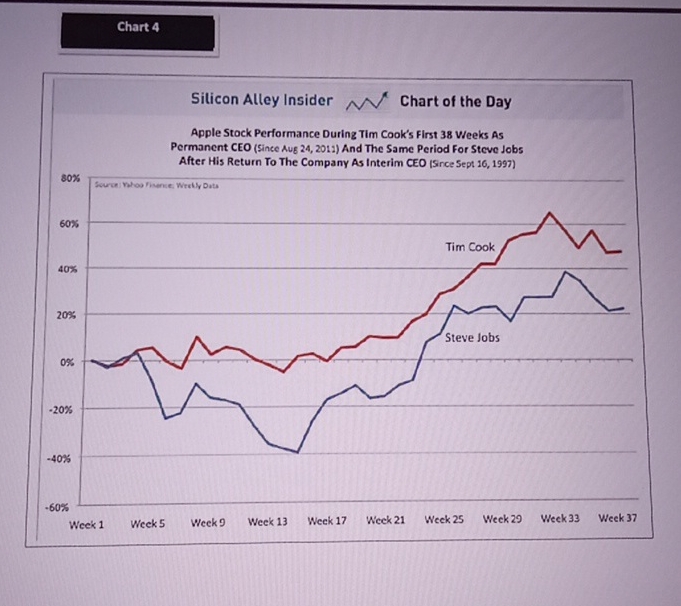
Apple Stock Performance During Tim Cook's First Weeks As Permanent CEO Since AuE And The Same Period For Steve Jobs After His Return To The Company As Interim CEO Since Sept
Step by Step Solution
There are 3 Steps involved in it
1 Expert Approved Answer
Step: 1 Unlock

Question Has Been Solved by an Expert!
Get step-by-step solutions from verified subject matter experts
Step: 2 Unlock
Step: 3 Unlock