

Question: Study the data sets (E, F, G, H, I) given below. DATA SET E Microprocessor Speed (MHz) and Power Dissipation (watts) (n = 14
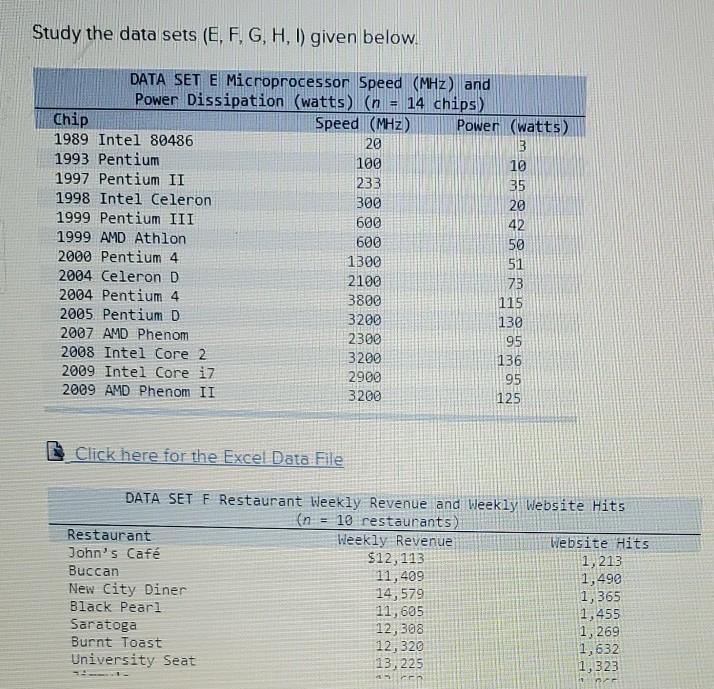
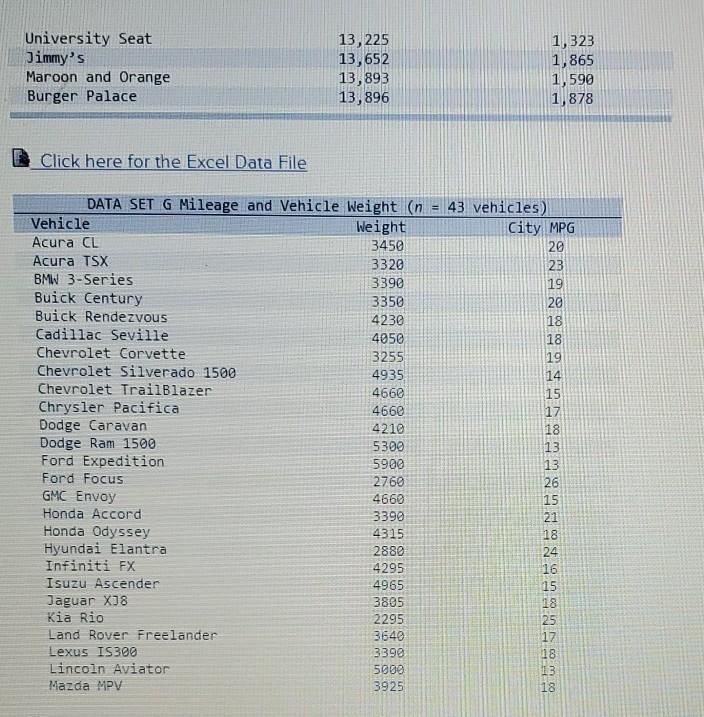
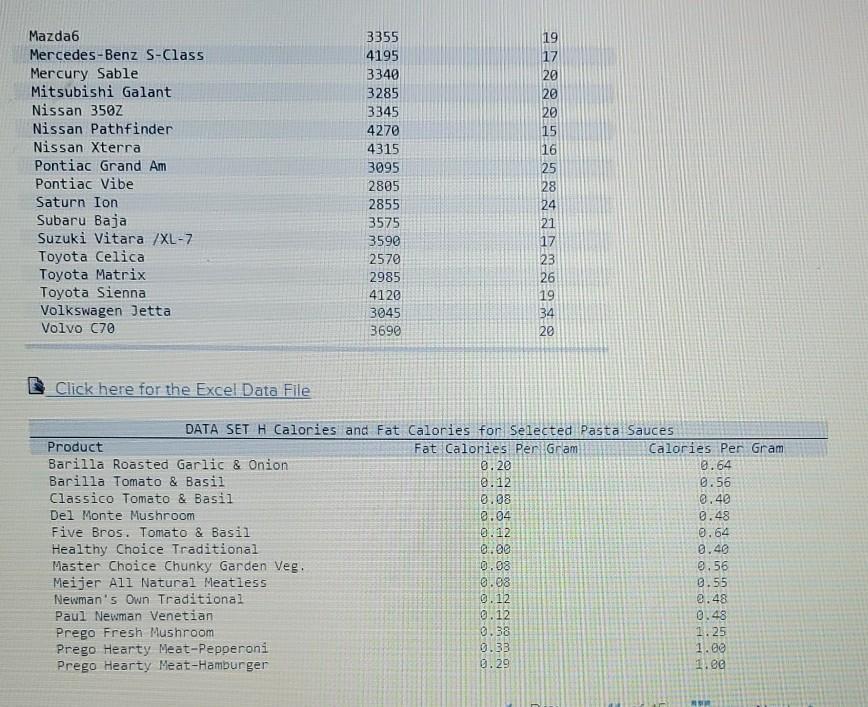
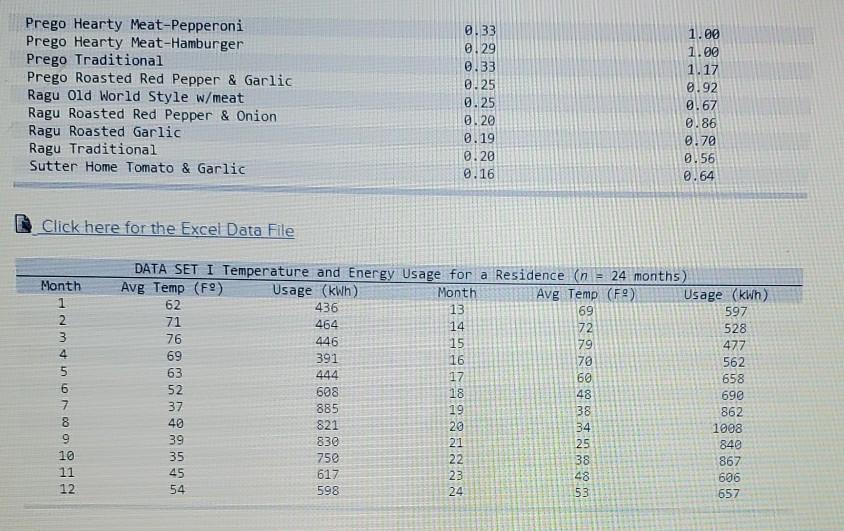
Study the data sets (E, F, G, H, I) given below. DATA SET E Microprocessor Speed (MHz) and Power Dissipation (watts) (n = 14 chips) Chip Speed (MHz) Power (watts) 1989 Intel 80486 20 1993 Pentium 100 10 1997 Pentium II 233 35 1998 Intel Celeron 300 20 1999 Pentium III 600 42 1999 AMD Athlon 600 50 2000 Pentium 4 1300 51 2004 Celeron D 2004 Pentium 4 2005 Pentium D 2100 73 3800 115 3200 130 2007 AMD Phenom 2300 95 2008 Intel Core 2 2009 Intel Core i7 2009 AMD Phenom II 3200 136 95 125 2900 3200 Click here for the Excel Data File DATA SET F Restaurant Weekly Revenue and Weekly Website Hits = 10 restaurants) Weekly Revenue $12,113 11,409 14,579 11,605 12,308 12,320 13,225 (n Restaurant John's Caf Website Hits 1,213 1,490 1,365 1,455 1, 269 1,632 1,323 Buccan New City Diner Black Pearl Saratoga Burnt Toast University Seat University Seat Jimmy's Maroon and Orange Burger Palace 13,225 13,652 13,893 13,896 1,323 1,865 1,590 1,878 Click here for the Excel Data File DATA SET G Mileage and Vehicle Weight (n = 43 vehicles) City MPG Vehicle Weight Acura CL 3450 20 Acura TSX 3320 3390 23 BMW 3-Series Buick Century Buick Rendezvous Cadillac Seville 19 3350 20 4230 18 4050 18 Chevrolet Corvette 3255 4935 19 Chevrolet Silverado 1500 Chevrolet TrailBlazer 14 4660 15 Chrysler Pacifica Dodge Caravan Dodge Ram 1500 Ford Expedition 4660 17 4210 18 5300 13 5900 13 Ford Focus 2760 26 GMC Envoy Honda Accord Honda Odyssey Hyundai Elantra Infiniti FX 4660 15 3390 21 4315 18 2880 4295 24 16 Isuzu Ascender 4965 15 Jaguar XJ8 Kia Rio 3805 18 2295 25 Land Rover Freelander 3640 17 Lexus IS300 3390 Lincoln Aviator 18 13 5000 Mazda MPV 3925 18 Mazda6 3355 19 Mercedes-Benz S-Class 4195 17 Mercury Sable Mitsubishi Galant Nissan 350Z 3340 20 3285 20 3345 20 Nissan Pathfinder 4270 15 Nissan Xterra 4315 16 Pontiac Grand Am Pontiac Vibe 3095 25 2805 28 Saturn Ion Subaru Baja Suzuki Vitara /XL-7 2855 24 3575 21 3590 17 Toyota Celica Toyota Matrix Toyota Sienna Volkswagen Jetta Volvo C70 2570 23 2985 26 4120 19 3045 34 3690 20 Click here for the Excel Data File DATA SET H Calories and Fat Calories for Selected Pasta Sauces Product Fat Calonies Per Gram 0.20 Calories Per Gram Barilla Roasted Garlic & Onion Barilla Tomato & Basil Classico Tomato & Basil 0.64 0.12 0.56 0.08 0.40 0.04 0.12 0.00 Del Monte Mushroom 0.48 Five Bros. Tomato & Basil 0.64 Healthy Choice Traditional Master Choice Chunky Garden Veg. Meijer All Natural Meatless Newman's Own Traditional 0.40 0.08 0.56 0.08 0.12 0.12 0.55 e.48 Paul Newman Venetian 0.48 0.38 Prego Fresh Mushroom Prego Hearty Meat-Pepperoni Prego Hearty Meat-Hamburger 1.25 0.33 1.00 0.29 1.e9 Prego Hearty Meat-Pepperoni Prego Hearty Meat-Hamburger Prego Traditional Prego Roasted Red Pepper & Garlic Ragu Old World Style w/meat Ragu Roasted Red Pepper & Onion Ragu Roasted Garlic Ragu Traditional Sutter Home Tomato & Garlic 0.33 1.00 0.29 1.00 0.33 1.17 0.25 0.92 0.25 0.67 0.20 0.86 0.19 0.70 0.20 0.56 0.16 0.64 Click here for the Excel Data File DATA SET I Temperature and Energy Usage for a Residence (n = 24 months) Avg Temp (F9) Month Usage (kwh) Avg Temp (F9) Month Usage (kwh) 597 1. 62 436 13 69 71 464 14 72 528 3 76 446 15 79 477 69 391 16 70 60 48 562 63 444 658 52 608 18 690 37 885 19 38 862 40 821 20 34 1008 39 830 21 25 840 10 35 750 22 38 867 11 45 617 23 48 606 12 54 598 24 53 657 mtni 678 00n E Click here for the Excel Data File Choose the correct option: T (for Time series data) and C (for Cross sectiona data). (Click to select) (Click to select Data set E Data set F Data setG (Click to select) Data set H (Click to select) (Click to select) Data set I
Step by Step Solution
There are 3 Steps involved in it
Let us first try to understand the difference between Crosssectional data and a Time Series data Tim... View full answer

Get step-by-step solutions from verified subject matter experts