

Question: Study the experimental data and graph. 1/ (1) ( ()) 0.0031 4.93 0.0032 4.46 0.0033 3.99 0.0034 3.52 0.0035 3.05 Which line on the graph
 Study the experimental data and graph.
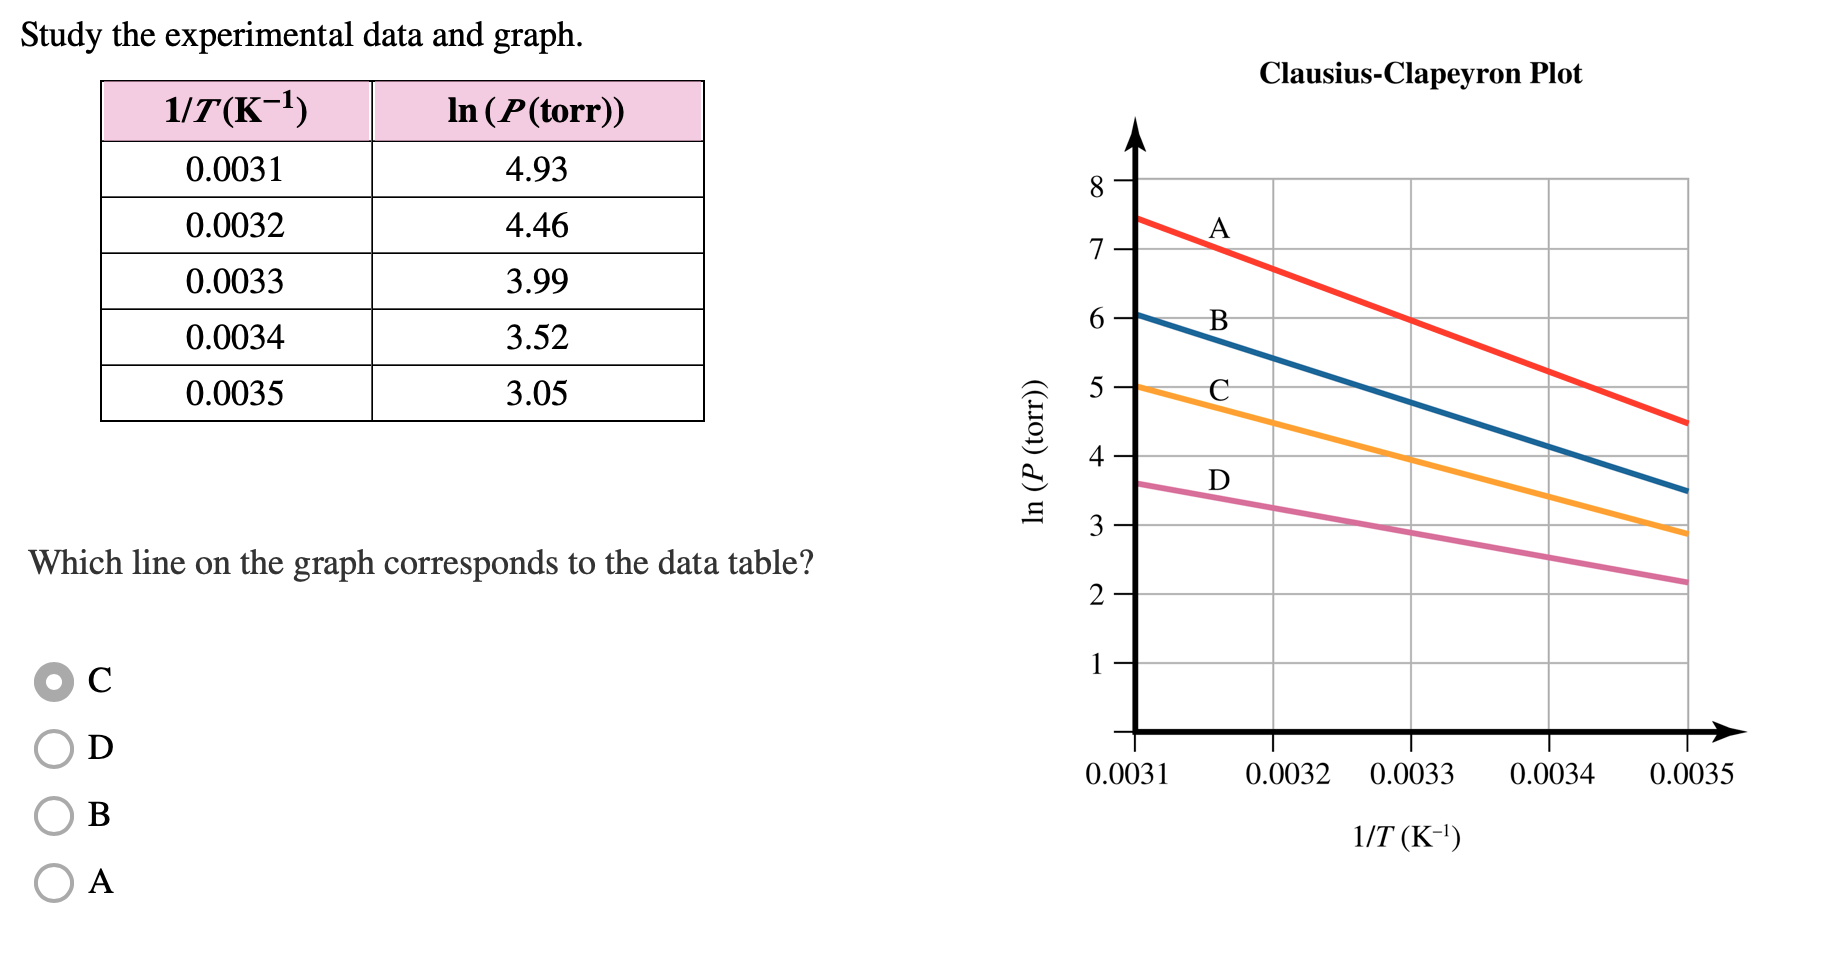
| 1/ (1) | ( ()) |
|---|---|
| 0.0031 | 4.93 |
| 0.0032 | 4.46 |
| 0.0033 | 3.99 |
| 0.0034 | 3.52 |
| 0.0035 | 3.05 |
Which line on the graph corresponds to the data table?
C
D
B
A
Calculate the slope of the line represented by the data.
slope:
K
Study the experimental data and graph. Clausius-Clapeyron Plot 1/1(K-1) In (P(torr) 4.93 0.0031 8 0.0032 4.46 A 7 0.0033 3.99 6 B 0.0034 3.52 0.0035 3.05 In (P (torr)) D 3 Which line on the graph corresponds to the data table? 2 C D 0.0031 0.0032 0.0033 0.0034 0.0035 B 1/T (K-) A
Step by Step Solution
There are 3 Steps involved in it
1 Expert Approved Answer
Step: 1 Unlock

Question Has Been Solved by an Expert!
Get step-by-step solutions from verified subject matter experts
Step: 2 Unlock
Step: 3 Unlock