

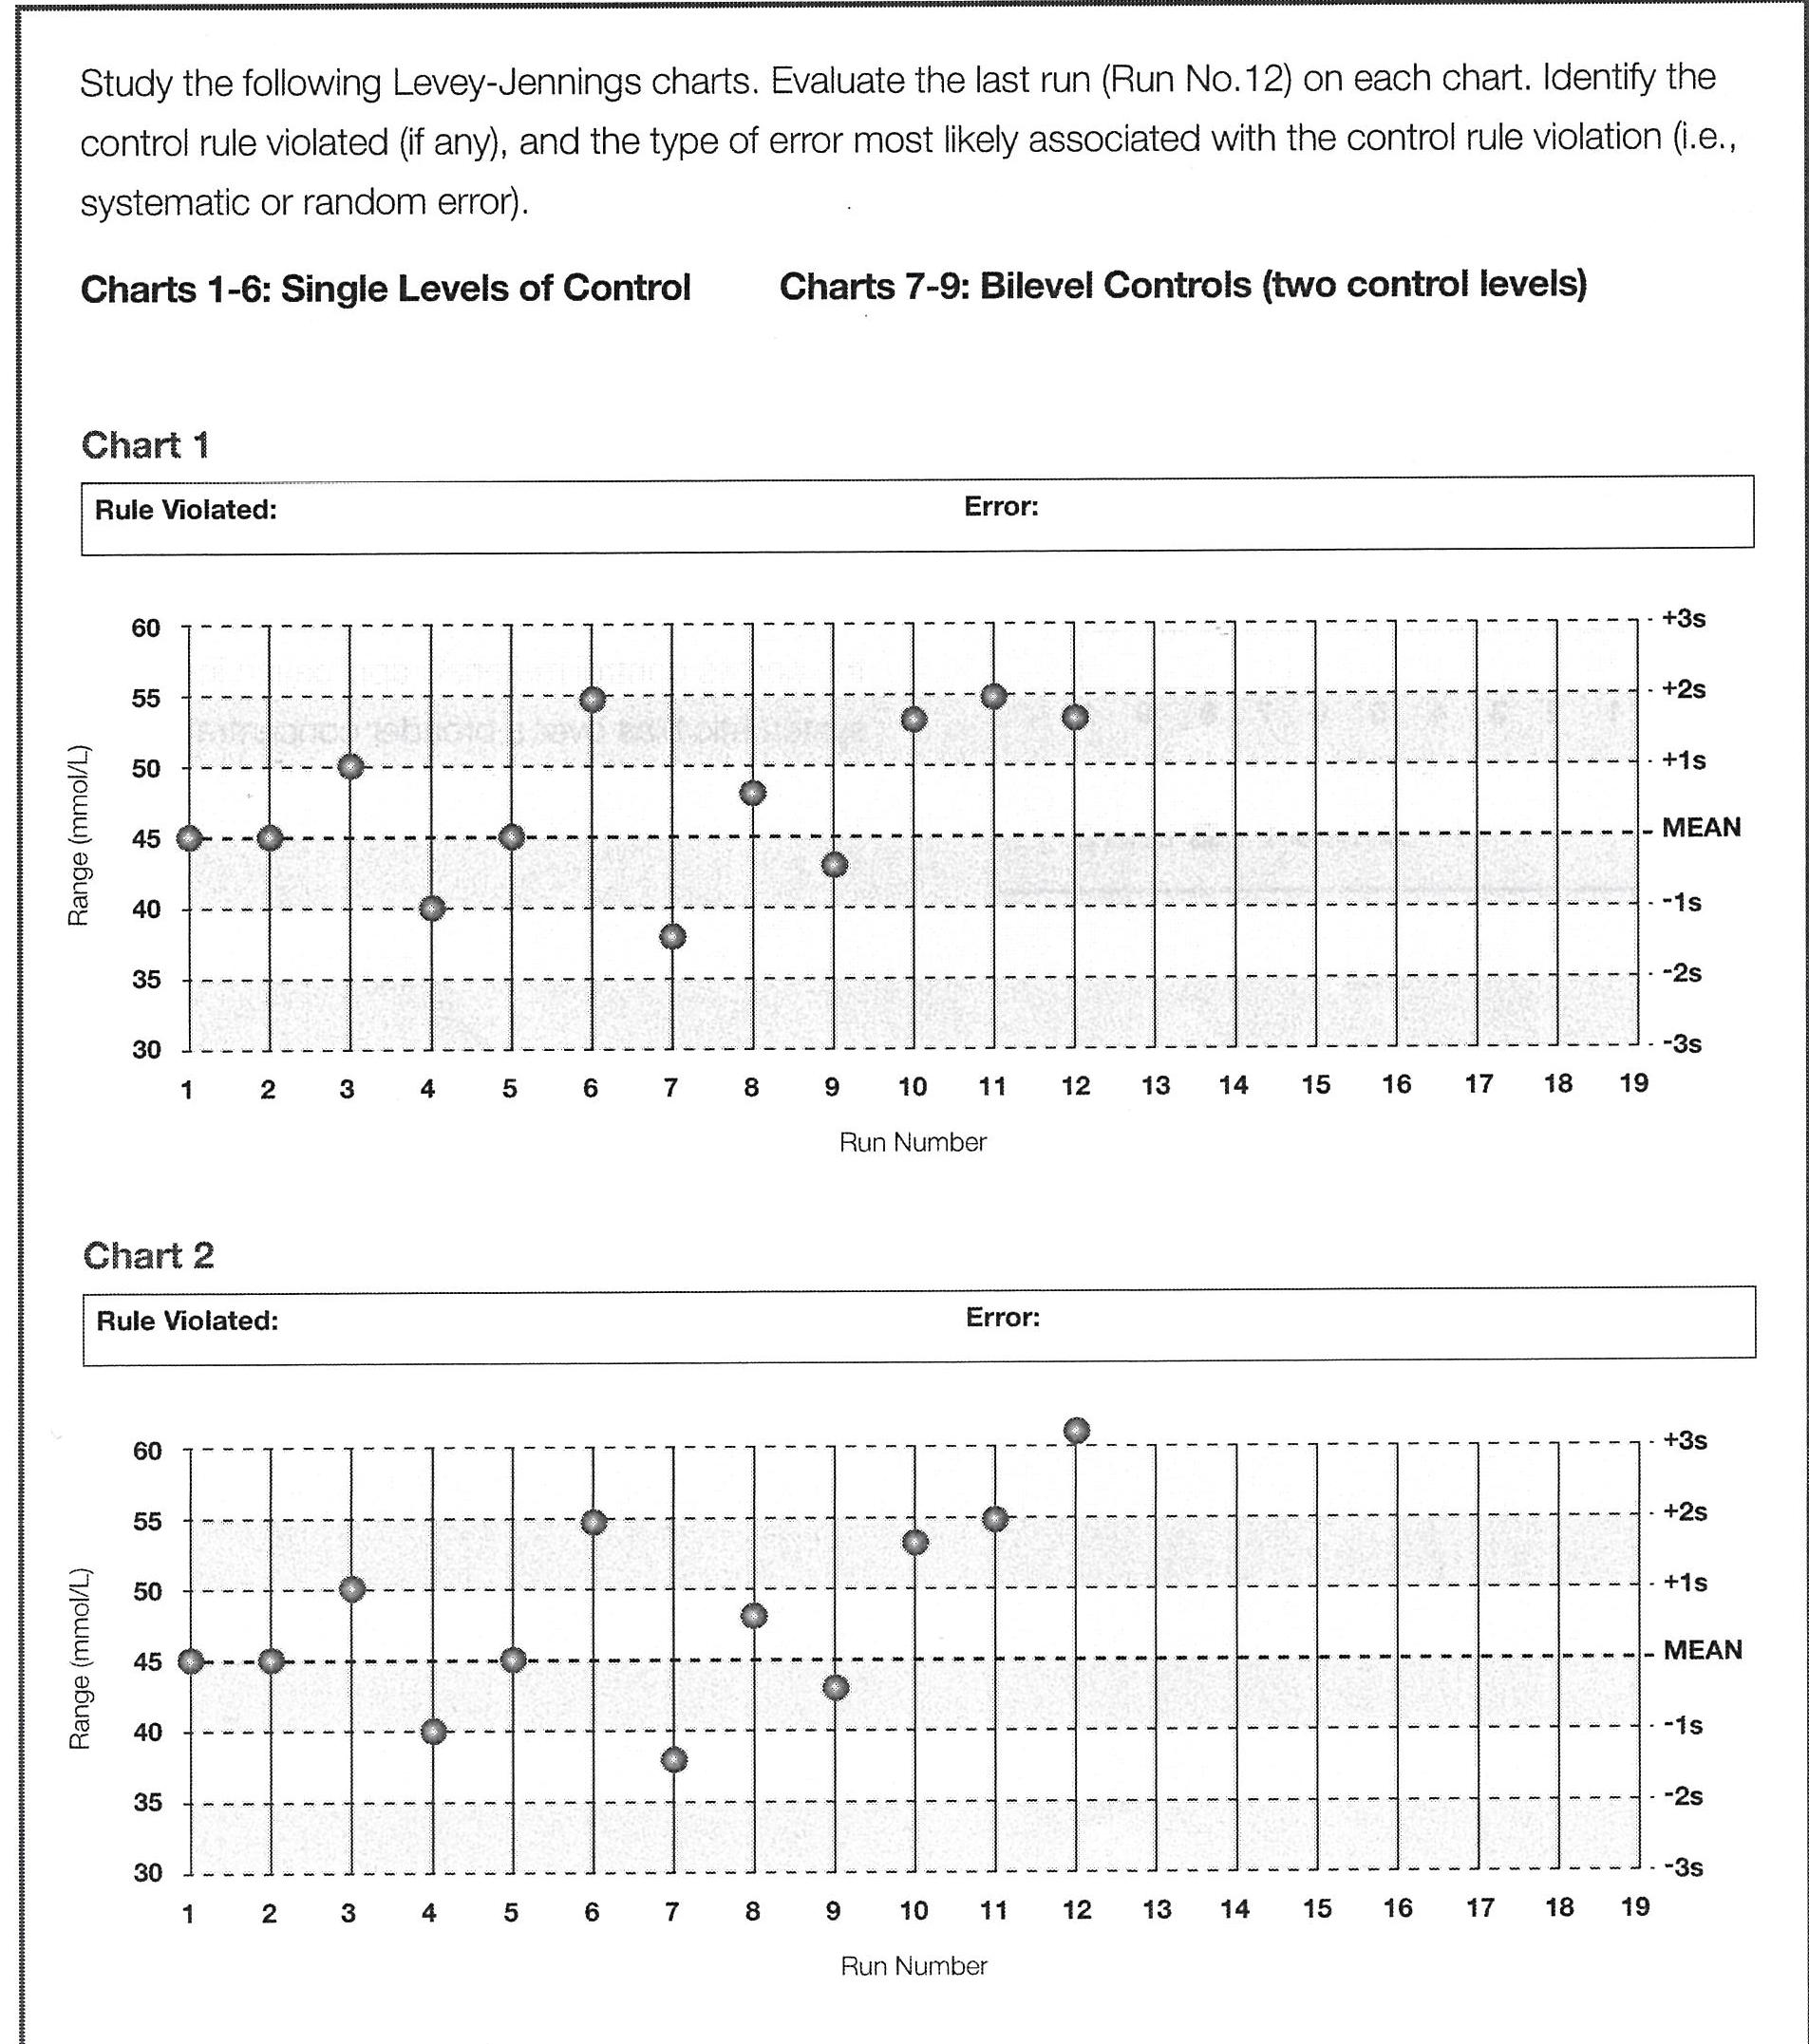
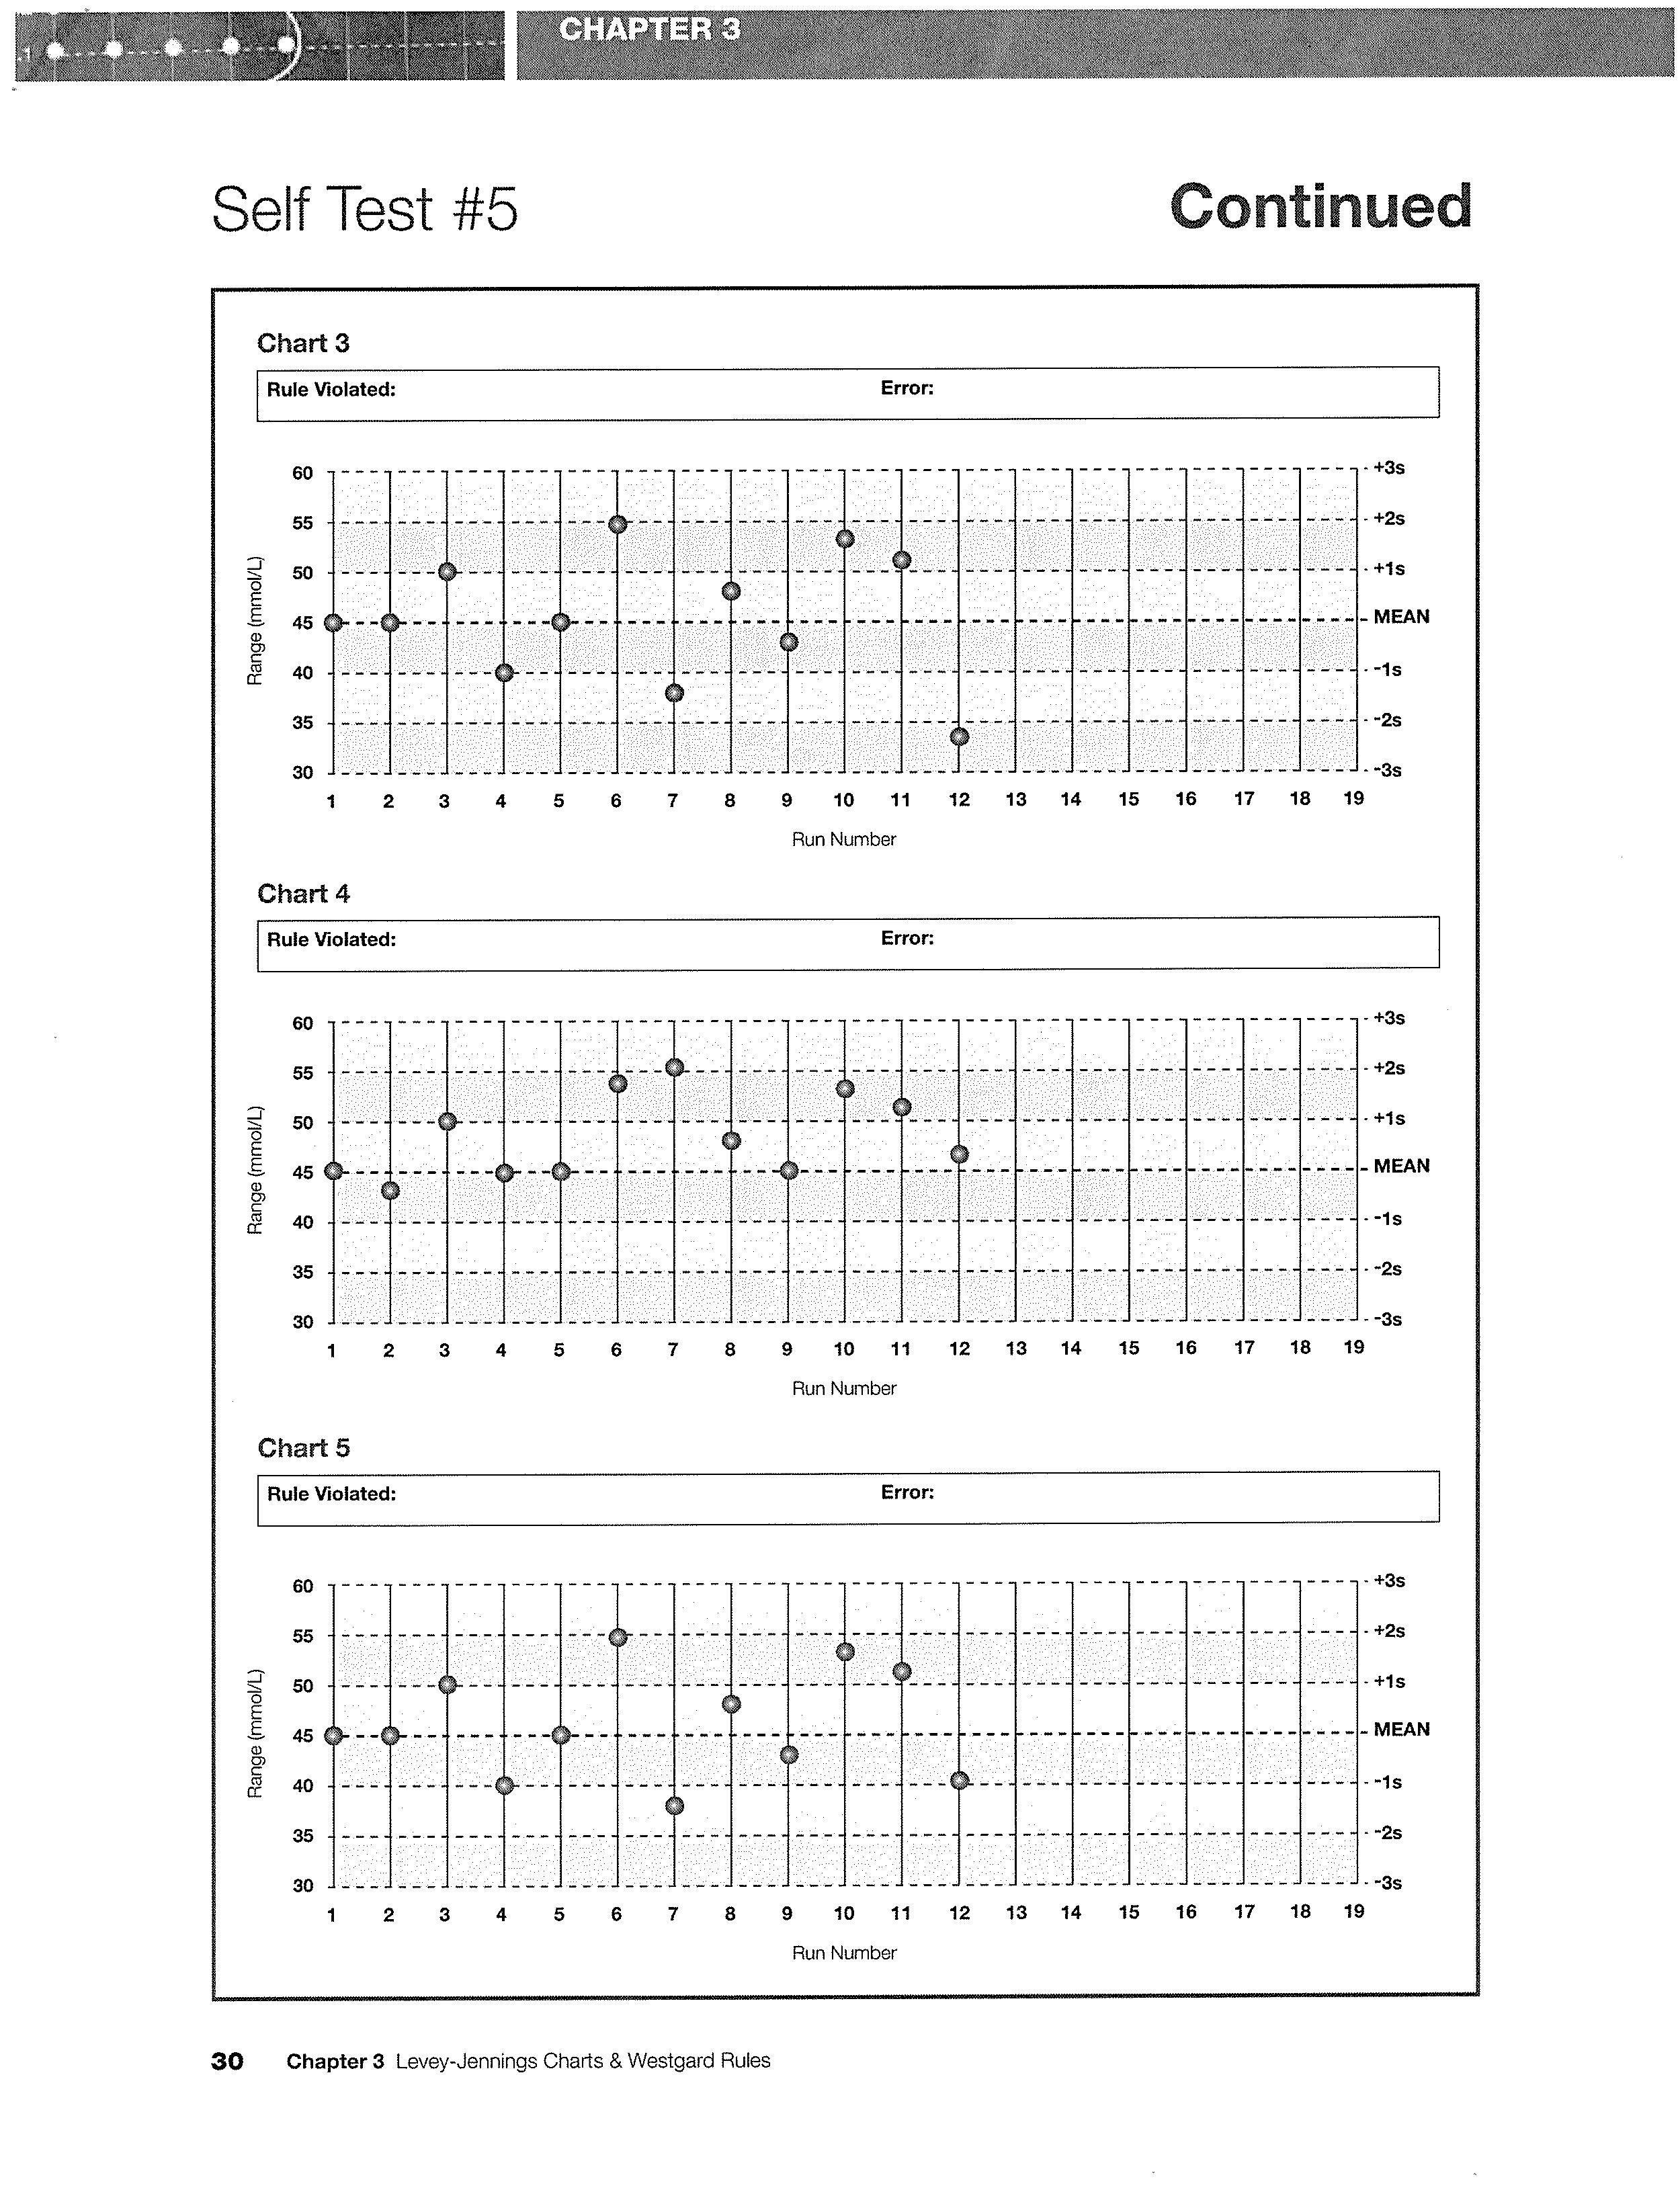
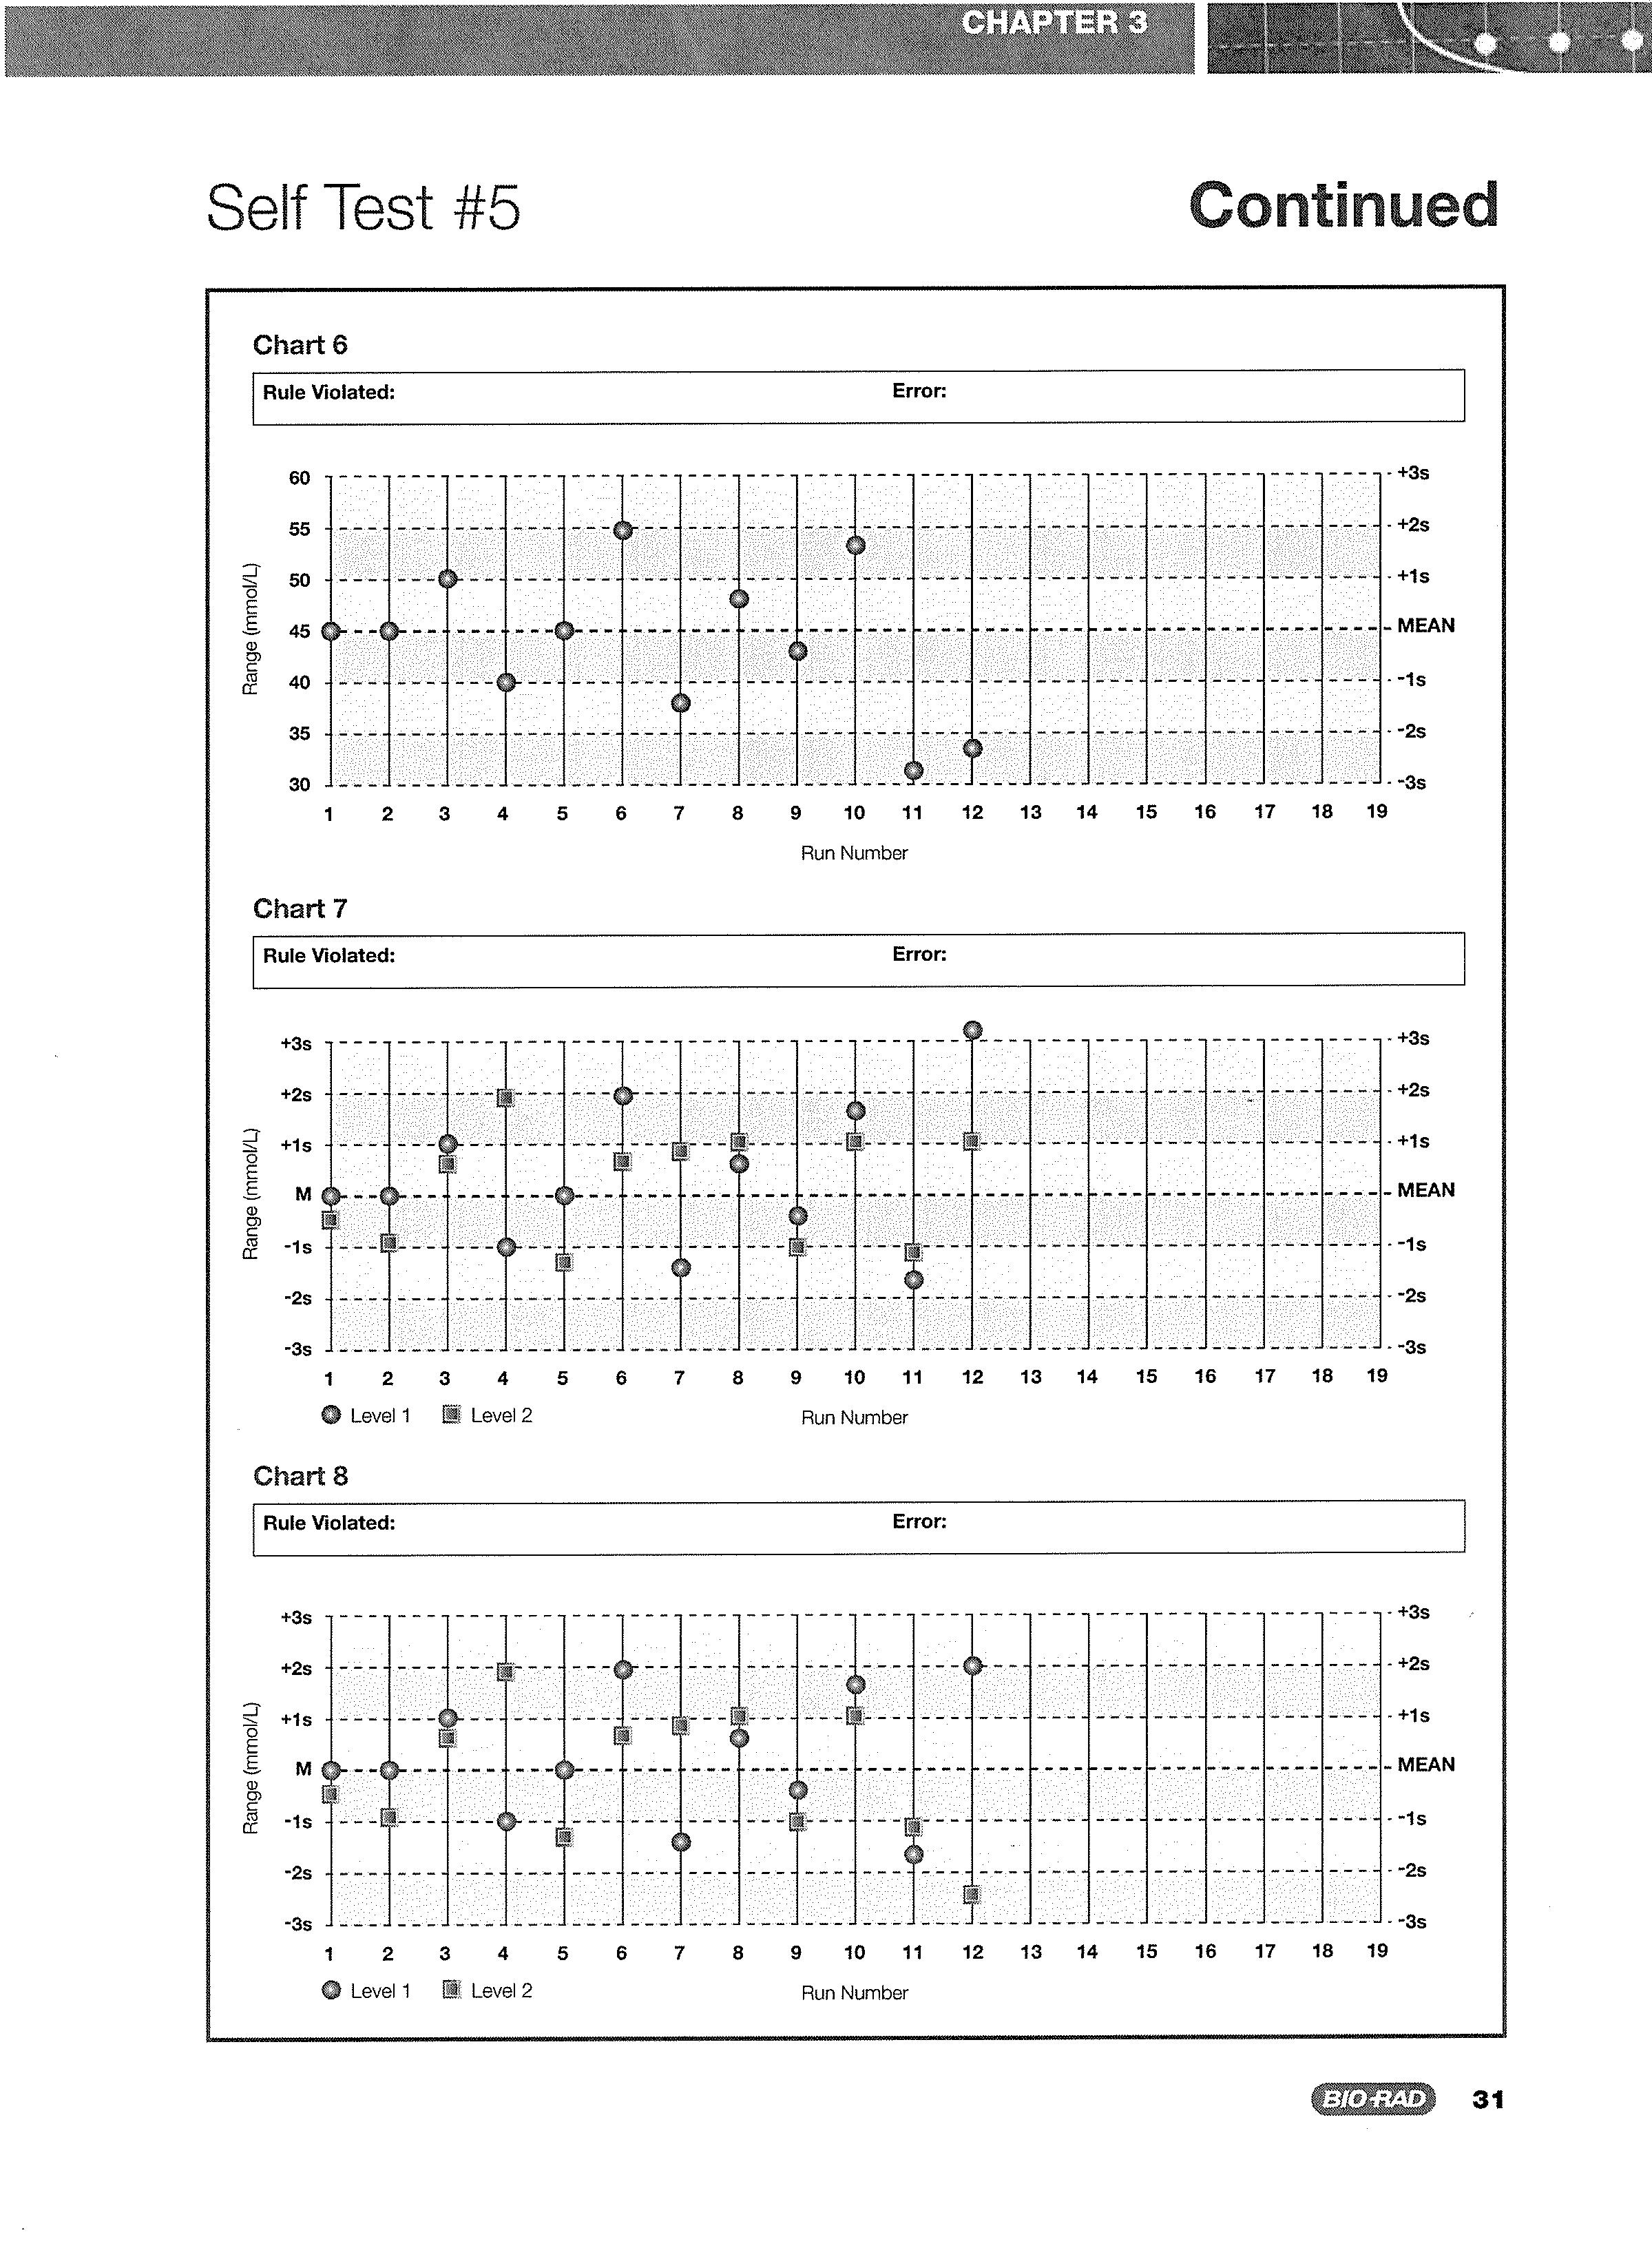
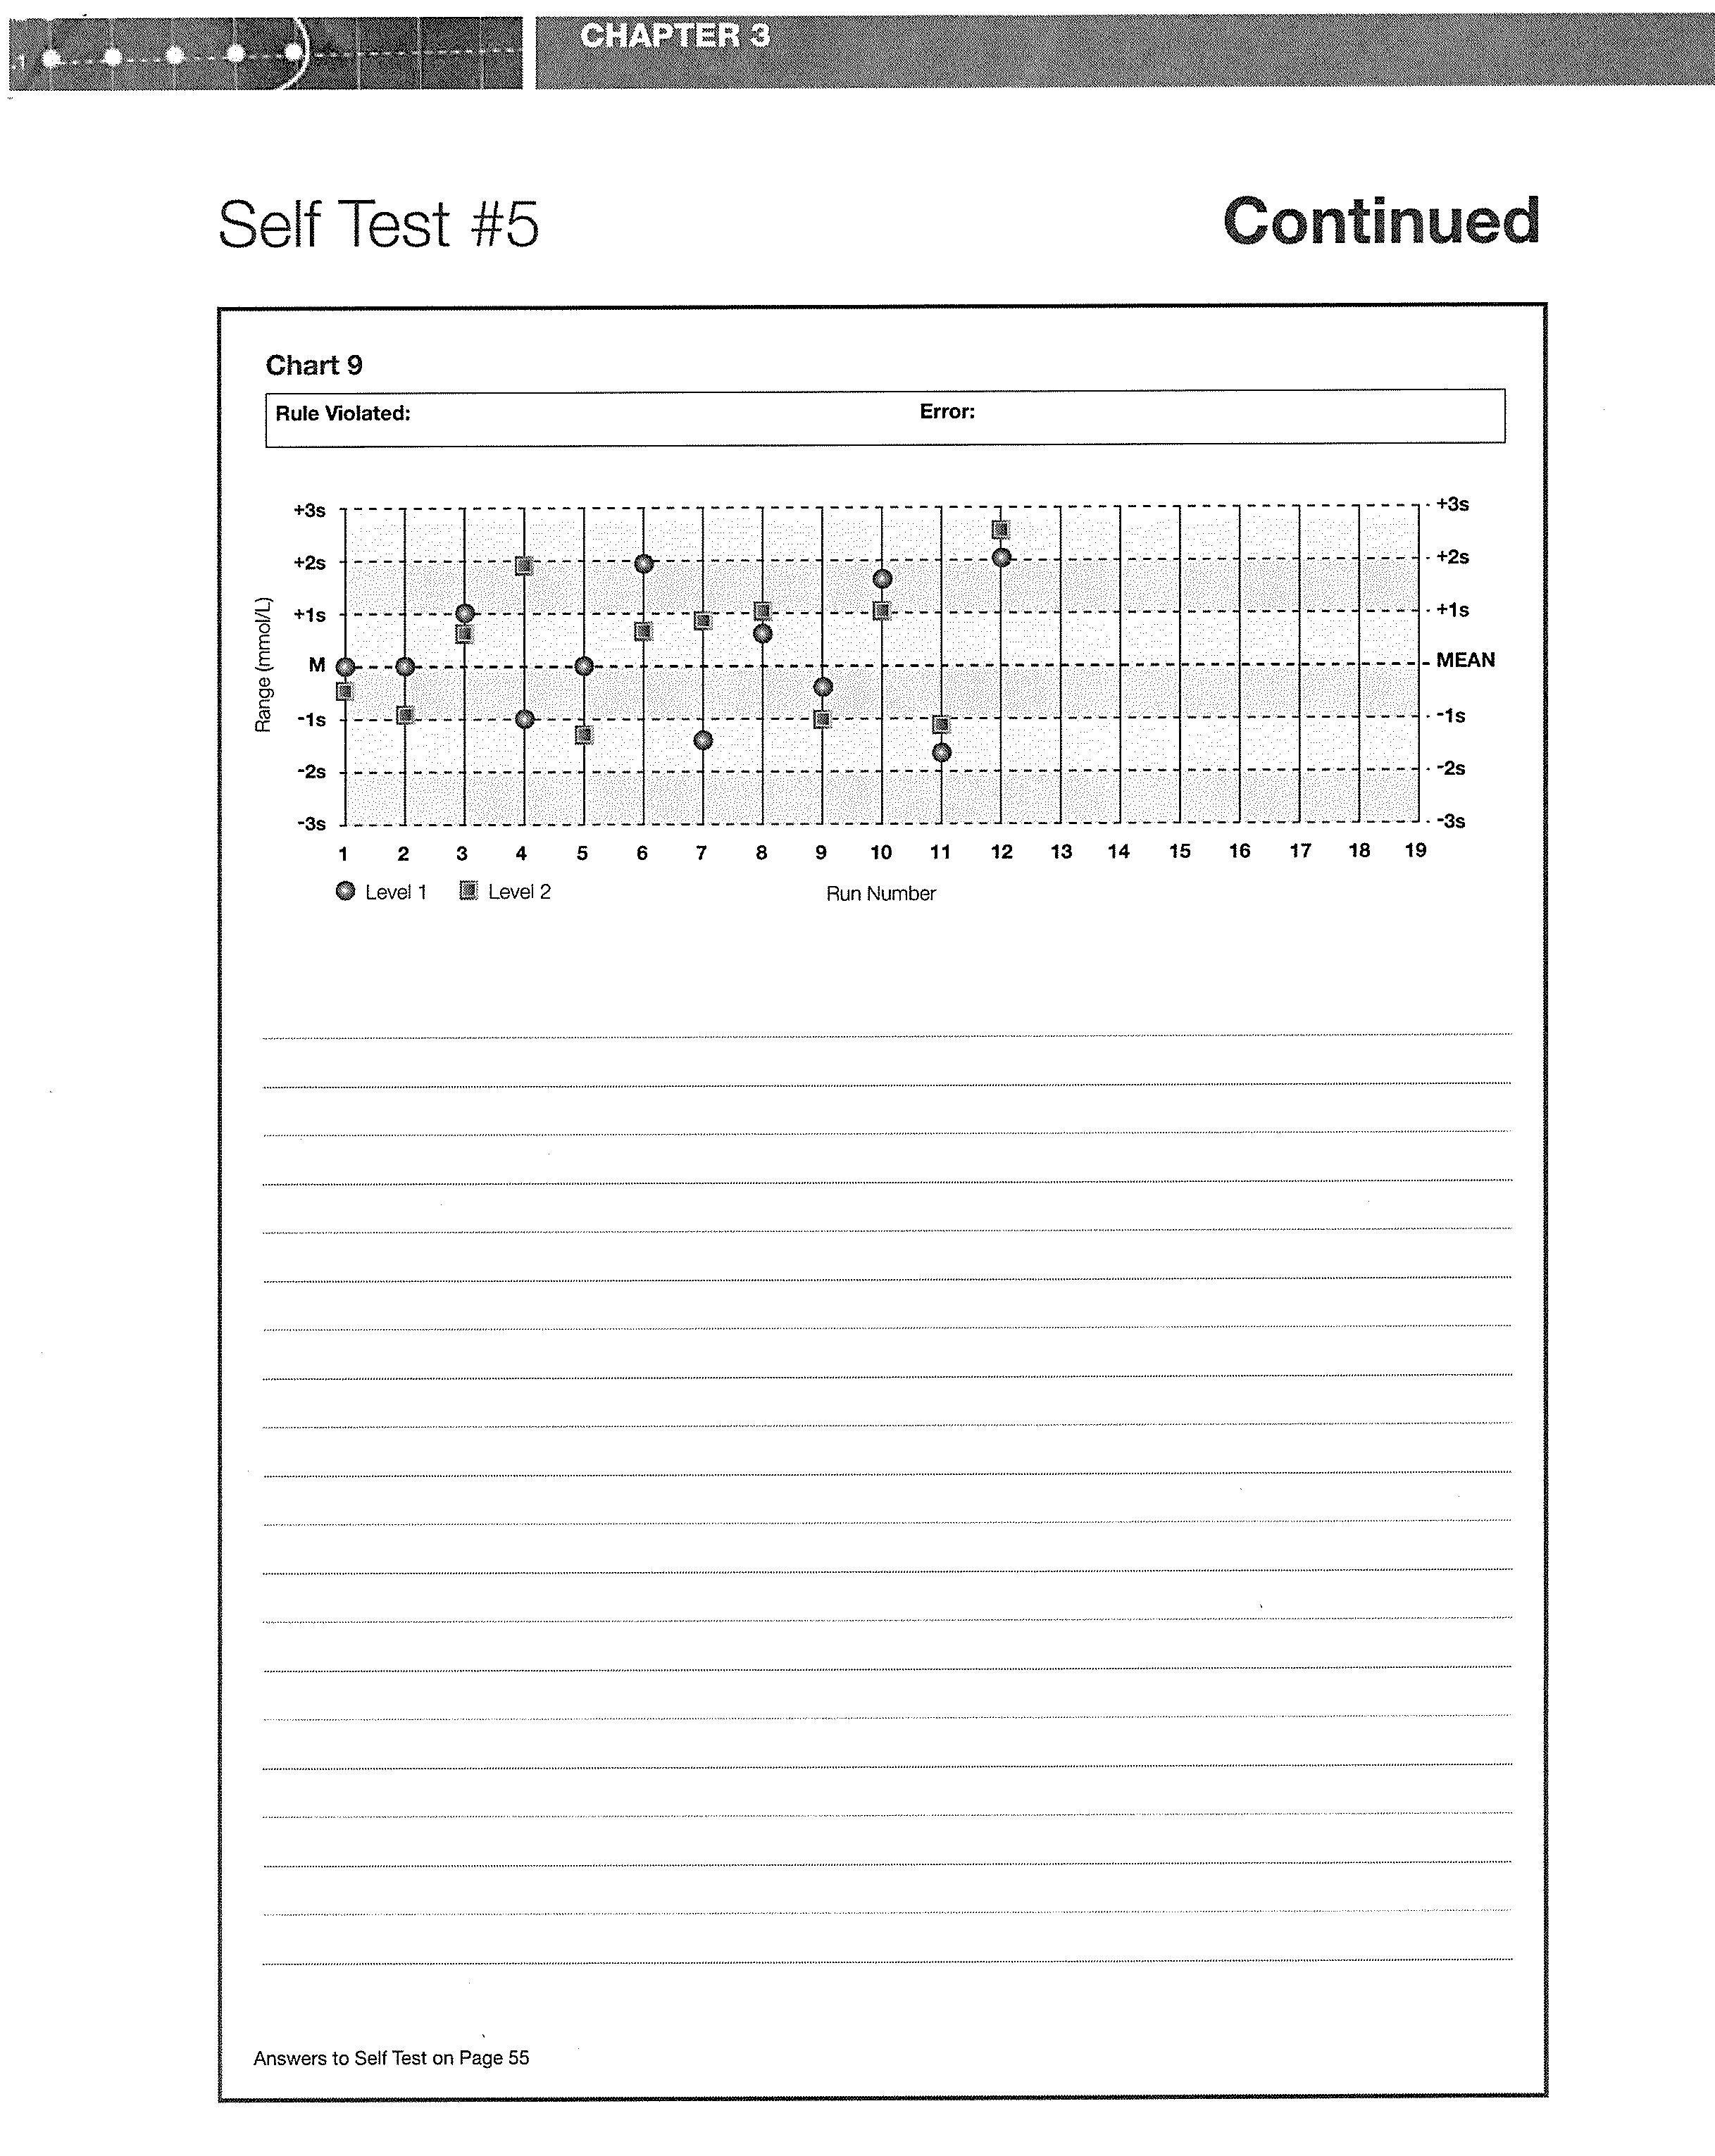
Study the following Levey-Jennings charts. Evaluate the last run (Run No.12) on each chart. Identify the...
Fantastic news! We've Found the answer you've been seeking!
Question:
Transcribed Image Text:
Study the following Levey-Jennings charts. Evaluate the last run (Run No.12) on each chart. Identify the control rule violated (if any), and the type of error most likely associated with the control rule violation (i.e., systematic or random error). Charts 1-6: Single Levels of Control Chart 1 Rule Violated: (mmol/L) Range( (mmol/L) 60 Range 55 50 45 40 35 30 60 55 50 45 40 35 + 30 1 1 L E + T 1 I } { Chart 2 Rule Violated: 3 1 3 1 į 1 8 3 I 3 3 3 1 3 E 1 1 I 1 1 2 { 2 wh 2 1 1 1 1 1 E 1 E E F 3 3 } 3 3 3 1 1 { 4 { 3 $ { I 3 1 { 1 1 3 3 3 A 1 B mi * 1 1 1 Bel 3 T F 1 3 { { 1 E 1 3 3 3 1 E F 1 1 3 1 3 1 3 1 3: 1 22 1 1 1 1 { { bange 31 4 3 1 3 { C 3 4 1 1 E 12 { 1 1 T 3 3 3 1 1 1 3 1 3 1 1 } 3 1 1 1 3: 1 1 20 1 3 1 1 1 10 1 5 1 { L 1 1 1 3: 1 1 3 1 31 1 3 3 { 18 1 1 1 1 3 3 1 1 1 { 5 6 7 3 3 1 3 1 3 31 6 31 1 3 3 1 3 3 3 3 3 3 8 1 1 3 1 1 3 F 1 1 1 E 3 3 7 1 3 1 1. 3 1 1 3 1 3 3 3 3 3 31 3 } 3 1 T 3 } 1 3 3 8 it 8 1 3 Charts 7-9: Bilevel Controls (two control levels) $ } } 3 1 3 3 2 3 3 1 3 3 } 9 P 9 { 1 3 Run Number 1 3 3 31 3 } 3 3 2 1 1 3 1 27 1 1 . 3 1 S 8. Error: 2 1 1 } 1 { 1 Error: Cy 1 Run Number { 3 1 E 3 { E 3 1 3 1 1 1 live 1. 3 T 1 3 3 1 1 1 3 1 T 1 1 31 3 E 1 I 1 3 3 3 1 1 1 R 2 T 1 1 3 3 L 1 BL 1 1 1 L { 3 1 3 T 1 19 1 J 1 B 8 1 33 } 1 1 } 1 t BR 1.... } 1 { 1 3 1 E 1 1 1 } 100 } E 1 3 8 } { 3 3 1 1 T 1 3: 1 { 2 3 - T 8 1. my 3 1 S 1 1 } 3 1. 10 11 12 13 14 15 16 17 18 19 1 3 10 11 12 13 14 15 1 1 32 1 3 3 { 1 1 1 1 1 3 M 1 } 3 1 1 1 1 3 1 1 1 1 1 { 3 } 3 { 1 16 151 10 E 3 1 1 31 3 Si 1 E 1 1 3 1 1 1 # $ 1 31 E E 1 3 J 1 8 $ 1 3. 31 10 14 { T 3 3 18 E } 3 1 1 8 1 17 5 1 1 F } 1 8 1 } 1 1 E 3 3 1 1 3 1 3 b } 1 1 { 3. S 1 1 L } 1 1 E E 2 11 BA! } 1 1 { 3 { J 18 E 3 } I 1 31 1 { 1 3 3 1 I 19 +3s +2s +1s MEAN -1s -2s -3s +3s +2s +1s MEAN -1s -2s -3s Self Test #5 Chart 3 (mmol/L) 30 Range (mmol/L) Range (օաա) Rule Violated: 09 Range 55 50 45 40 35 30 Chart 4 60 55 50 45 40 35 30 60 55 50 Rule Violated: Chart 5 45 40 * 1 35 1. 30 1 Sex : 1 1 1 . 1 # 33 ·1 } ... t 1 1 Rule Violated: J 1 1 1 Y T 1 1 1. E 1: 1: T: .. 2 1 2 2 2 1 1. 1 1: f 1 1 t 1 } : 1. 1 1 1 1: B { $ { 1. 6 .I 1. 1. 1. 1 1 1: RE 1 I 1 1 . 1 1 } i I 1 ♡ B 3 3 I t 1 3 t 1 . i 1: 1.. I # I 1 # 1 1 f. 1. 4 4 4 1 t 1. t E CHAPTER 3 5 5 5 1. 1 J. 1. 6 (0) 9 B 1 1. 1:1 1.. 7 7 6 7 J 1 1. I :1 8 00 8 * 8 1. 1 1 1. 1. 1 . 1. Chapter 3 Levey-Jennings Charts & Westgard Rules 9 9 * 9 1: 1 1. 1: 1 1 Run Number 1 } 1 1 1 · 10 L 1 1 1 $ 10 Run Number 1 ī T 1: 1. 1. 10 # 1. 1 Error: 1: F: 1. $ 1. I 1 Error: 11 1 11 1 1 I Cate . Error: Run Number 1 # t 1 1 1 13 1. 1: 1 1: .1 1 4. B I 12 13 14 15 16 1 F 1 :1 T 1 1: 12 13 1 3 1 I 1: 1 # 1: NA 1. 1. F .: 1 1 E ... 1 . t ?. 1. E 1 E :{ 1 1 i 1 1 1 .. .. 1 t 1. 1 1 E L 1. I : 1 14 1 2 1 1 ·| I 1 1 1 1 I 1. 1: T 1 i 1. I 1: J 1 15 I T. 1. 1 Continued 12 13 14 15 3 16 17 E. .I *. } 16 E. 1 17 F 1 4 1. .. 1 1. 1. 2 ·1 18 19 18 t # - 19 17 18 19 +3s +2s +15 MEAN -1s -2s -3s +3s +2s +15 MEAN -1s -2s -3s +35 +2s +1s MEAN -1s -2s -3s Self Test #5 Chart 6 Rule Violated: (7/10) Range (օաա) Range 60 55 Range (mmol/L) 50 45 40 35 30 Chart 7 +3s +2s +1s M -1s -2s -3s +3s Chart 8 +2s 1 Rule Violated: +1s M -1s i .1 1 -3s 1. 1 M I $ f I 1. WWW Rule Violated: ! 1 W 1 1 2 I i 1: 2 Level 1 #: 3. i 1 2 Level 1 1 1 ♡ 3 3 L.. L: 4 } Level 2 4 5 6 7 8 9 10 1 Level 2 1 S 5 1 1: 1 1 .1 1 .I. J. 1 1 $ I ". 1. !. 1 I A E 1 I 1 1 I 7 * 1: 6 7 .. 1: 1. 1. 1 I ! 1 1. 1. UR 1 1 1 F 1. t 1: I I 8 8 { · 1 E 9 9 Run Number ". a # 10 t 1 Error: 10 11 Run Number 1 Error: 1. 11 Error: 1. Run Number 1 11 I -1 *. 1 1: 1 I CHAPTER 3 12 12 18 :) 13 4: 13 12 13 A 14 T: .. .. A E .. @ D 15 Continued B 14 15 16 1 1. 1. t 16 17 18 19 J F. .. 5 + A F 1. 1 1 1. 1. $ { i 1. ► 8 MA .. 1 1 1. *. 1. 1. .: 14 15 16 17 1 1 i 1 81 . 1 1 1 $. ² 1 1. 1: # .f 1 ... .1 I 1 1 1. I I 18 1 1: I 1 :| 1 IL 1: 30 .. J. E 1: T 19 18 19 +3s +2s +1s MEAN -1s -2s -3s +3s +2s +1s MEAN -1s -25 -3s +3s +2s +1s MEAN -1s -2s -3s BIO RAD 31 Self Test #5 Chart 9 Rule Violated: Range (mmol/L) +3s +2s +1s 3 -1s -2s -3s 1 1: 2 Level 1 3 4 5 Level 2 CHAPTER 3 Answers to Self Test on Page 55 6 1: 7 9 1. 10 1 Error: 11 Run Number -1 ! 10 1. 12 * B 13 I $ 1 1. A 1: 1. 18 1 1 13 Continued I T t 14 15 16 1 1. 1. I 1: t B .. 1 .. J 1: 1. I IS 1. 1 17 J: LE 1 1 E 1 # a T Kat 18 19 +3s +2s +1s MEAN -1s -2s -3s Study the following Levey-Jennings charts. Evaluate the last run (Run No.12) on each chart. Identify the control rule violated (if any), and the type of error most likely associated with the control rule violation (i.e., systematic or random error). Charts 1-6: Single Levels of Control Chart 1 Rule Violated: (mmol/L) Range( (mmol/L) 60 Range 55 50 45 40 35 30 60 55 50 45 40 35 + 30 1 1 L E + T 1 I } { Chart 2 Rule Violated: 3 1 3 1 į 1 8 3 I 3 3 3 1 3 E 1 1 I 1 1 2 { 2 wh 2 1 1 1 1 1 E 1 E E F 3 3 } 3 3 3 1 1 { 4 { 3 $ { I 3 1 { 1 1 3 3 3 A 1 B mi * 1 1 1 Bel 3 T F 1 3 { { 1 E 1 3 3 3 1 E F 1 1 3 1 3 1 3 1 3: 1 22 1 1 1 1 { { bange 31 4 3 1 3 { C 3 4 1 1 E 12 { 1 1 T 3 3 3 1 1 1 3 1 3 1 1 } 3 1 1 1 3: 1 1 20 1 3 1 1 1 10 1 5 1 { L 1 1 1 3: 1 1 3 1 31 1 3 3 { 18 1 1 1 1 3 3 1 1 1 { 5 6 7 3 3 1 3 1 3 31 6 31 1 3 3 1 3 3 3 3 3 3 8 1 1 3 1 1 3 F 1 1 1 E 3 3 7 1 3 1 1. 3 1 1 3 1 3 3 3 3 3 31 3 } 3 1 T 3 } 1 3 3 8 it 8 1 3 Charts 7-9: Bilevel Controls (two control levels) $ } } 3 1 3 3 2 3 3 1 3 3 } 9 P 9 { 1 3 Run Number 1 3 3 31 3 } 3 3 2 1 1 3 1 27 1 1 . 3 1 S 8. Error: 2 1 1 } 1 { 1 Error: Cy 1 Run Number { 3 1 E 3 { E 3 1 3 1 1 1 live 1. 3 T 1 3 3 1 1 1 3 1 T 1 1 31 3 E 1 I 1 3 3 3 1 1 1 R 2 T 1 1 3 3 L 1 BL 1 1 1 L { 3 1 3 T 1 19 1 J 1 B 8 1 33 } 1 1 } 1 t BR 1.... } 1 { 1 3 1 E 1 1 1 } 100 } E 1 3 8 } { 3 3 1 1 T 1 3: 1 { 2 3 - T 8 1. my 3 1 S 1 1 } 3 1. 10 11 12 13 14 15 16 17 18 19 1 3 10 11 12 13 14 15 1 1 32 1 3 3 { 1 1 1 1 1 3 M 1 } 3 1 1 1 1 3 1 1 1 1 1 { 3 } 3 { 1 16 151 10 E 3 1 1 31 3 Si 1 E 1 1 3 1 1 1 # $ 1 31 E E 1 3 J 1 8 $ 1 3. 31 10 14 { T 3 3 18 E } 3 1 1 8 1 17 5 1 1 F } 1 8 1 } 1 1 E 3 3 1 1 3 1 3 b } 1 1 { 3. S 1 1 L } 1 1 E E 2 11 BA! } 1 1 { 3 { J 18 E 3 } I 1 31 1 { 1 3 3 1 I 19 +3s +2s +1s MEAN -1s -2s -3s +3s +2s +1s MEAN -1s -2s -3s Self Test #5 Chart 3 (mmol/L) 30 Range (mmol/L) Range (օաա) Rule Violated: 09 Range 55 50 45 40 35 30 Chart 4 60 55 50 45 40 35 30 60 55 50 Rule Violated: Chart 5 45 40 * 1 35 1. 30 1 Sex : 1 1 1 . 1 # 33 ·1 } ... t 1 1 Rule Violated: J 1 1 1 Y T 1 1 1. E 1: 1: T: .. 2 1 2 2 2 1 1. 1 1: f 1 1 t 1 } : 1. 1 1 1 1: B { $ { 1. 6 .I 1. 1. 1. 1 1 1: RE 1 I 1 1 . 1 1 } i I 1 ♡ B 3 3 I t 1 3 t 1 . i 1: 1.. I # I 1 # 1 1 f. 1. 4 4 4 1 t 1. t E CHAPTER 3 5 5 5 1. 1 J. 1. 6 (0) 9 B 1 1. 1:1 1.. 7 7 6 7 J 1 1. I :1 8 00 8 * 8 1. 1 1 1. 1. 1 . 1. Chapter 3 Levey-Jennings Charts & Westgard Rules 9 9 * 9 1: 1 1. 1: 1 1 Run Number 1 } 1 1 1 · 10 L 1 1 1 $ 10 Run Number 1 ī T 1: 1. 1. 10 # 1. 1 Error: 1: F: 1. $ 1. I 1 Error: 11 1 11 1 1 I Cate . Error: Run Number 1 # t 1 1 1 13 1. 1: 1 1: .1 1 4. B I 12 13 14 15 16 1 F 1 :1 T 1 1: 12 13 1 3 1 I 1: 1 # 1: NA 1. 1. F .: 1 1 E ... 1 . t ?. 1. E 1 E :{ 1 1 i 1 1 1 .. .. 1 t 1. 1 1 E L 1. I : 1 14 1 2 1 1 ·| I 1 1 1 1 I 1. 1: T 1 i 1. I 1: J 1 15 I T. 1. 1 Continued 12 13 14 15 3 16 17 E. .I *. } 16 E. 1 17 F 1 4 1. .. 1 1. 1. 2 ·1 18 19 18 t # - 19 17 18 19 +3s +2s +15 MEAN -1s -2s -3s +3s +2s +15 MEAN -1s -2s -3s +35 +2s +1s MEAN -1s -2s -3s Self Test #5 Chart 6 Rule Violated: (7/10) Range (օաա) Range 60 55 Range (mmol/L) 50 45 40 35 30 Chart 7 +3s +2s +1s M -1s -2s -3s +3s Chart 8 +2s 1 Rule Violated: +1s M -1s i .1 1 -3s 1. 1 M I $ f I 1. WWW Rule Violated: ! 1 W 1 1 2 I i 1: 2 Level 1 #: 3. i 1 2 Level 1 1 1 ♡ 3 3 L.. L: 4 } Level 2 4 5 6 7 8 9 10 1 Level 2 1 S 5 1 1: 1 1 .1 1 .I. J. 1 1 $ I ". 1. !. 1 I A E 1 I 1 1 I 7 * 1: 6 7 .. 1: 1. 1. 1 I ! 1 1. 1. UR 1 1 1 F 1. t 1: I I 8 8 { · 1 E 9 9 Run Number ". a # 10 t 1 Error: 10 11 Run Number 1 Error: 1. 11 Error: 1. Run Number 1 11 I -1 *. 1 1: 1 I CHAPTER 3 12 12 18 :) 13 4: 13 12 13 A 14 T: .. .. A E .. @ D 15 Continued B 14 15 16 1 1. 1. t 16 17 18 19 J F. .. 5 + A F 1. 1 1 1. 1. $ { i 1. ► 8 MA .. 1 1 1. *. 1. 1. .: 14 15 16 17 1 1 i 1 81 . 1 1 1 $. ² 1 1. 1: # .f 1 ... .1 I 1 1 1. I I 18 1 1: I 1 :| 1 IL 1: 30 .. J. E 1: T 19 18 19 +3s +2s +1s MEAN -1s -2s -3s +3s +2s +1s MEAN -1s -25 -3s +3s +2s +1s MEAN -1s -2s -3s BIO RAD 31 Self Test #5 Chart 9 Rule Violated: Range (mmol/L) +3s +2s +1s 3 -1s -2s -3s 1 1: 2 Level 1 3 4 5 Level 2 CHAPTER 3 Answers to Self Test on Page 55 6 1: 7 9 1. 10 1 Error: 11 Run Number -1 ! 10 1. 12 * B 13 I $ 1 1. A 1: 1. 18 1 1 13 Continued I T t 14 15 16 1 1. 1. I 1: t B .. 1 .. J 1: 1. I IS 1. 1 17 J: LE 1 1 E 1 # a T Kat 18 19 +3s +2s +1s MEAN -1s -2s -3s
Expert Answer:

Related Book For 

Business Statistics For Contemporary Decision Making
ISBN: 978-1118749647
8th edition
Authors: Black Ken
Posted Date:
Students also viewed these databases questions
-
A corporation commenced operations on January 1, 2019. It has the following account balances at December 31, 2019: Accounts Payable $35,000 Accounts 45,000 Receivable Bank Loan 65,000 Building 67,000...
-
2-) Would be possible to A-B melt at 1300K at 1300k. B from the vapor refine conditions given below. Write colculations XB = 0,4 9B-0,200 aa =0,600 Po B = 2x 10⁻⁶ POA = 4x10⁻⁶
-
Suppose you have a balance of $3,950 on your credit card, which charges an APR of 30%, compounded monthly. If you want to pay off the balance in 24 months, how much should you pay each month? Assume...
-
Use Lagrange multipliers to find the maximum area of a rectangle inscribed in the ellipse (Figure 15): (-x,y) (x, y) 2 a2 b2 + J2 = 1 (x, y) (x, y) X
-
In 1993, Mr. L paid $18,000 for a newly issued BN bond with a $30,000 stated redemption value. He has recognized $6,000 of the original issue discount (OID) as ordinary interest income. This year, BN...
-
Calculate v1 and v2 in the circuit of Fig. 3.62 using nodal analysis. Figure 3.62 AW 8 0 4 3 A
-
A researcher wants to determine whether children are more likely to be born on certain days of the week. She will sample 350 births and record the day of the week for each. The null hypothesis is...
-
A large St. Louis feed mill, Robert Orwig Processing, prepares its 6- month aggregate plan by forecasting demand for 50- pound bags of cattle feed as follows: January, 1,000 bags; February, 1,200;...
-
Begin by preparing a vertical analysis of Martin's assets for 2024, then prepare a vertical analysis f 2023. (Round the percent of total amounts Martin Optical Company Balance Sheet (partial)...
-
Cherry Cotta makes custom ordered clay pots for residential gardens. Below is cost information regarding its latest job. a. Materials were purchased on account. $18,996 purchased b. A materials...
-
a. Complete the stock card in the pro forma book provided using the Moving Weighted Average method of inventory valuation and then calculate the gross profit. Con has been reviewing his inventory and...
-
Which male target tissues respond to testosterone, and which require dihydrotestosterone? If Scarlett wishes to continue life as a woman, what is the appropriate treatment? If Scarlett wishes to live...
-
Express each of these statements using quantifiers. Then form the negation of the statement so that no negation is to the left of a quantifier. Next, express the negation in simple English. The...
-
Explain the alternative accounting methods for situations relating to long term liabilities and equity
-
A micro-entrepreneur, has a small business which sells products or applications which improve online viewing experience. She is considering borrowing money from a crowdlending platform to expand her...
-
at the beginning of the year addisons companys assests are 1 5 8 0 0 0 and its equity is 1 1 8 5 0 0 . during the year assets increase 8 0 0 0 0 and liabilities increase 4 8 0 0 0 . what is the...
-
-Write out the 4-dimensional vector for (a (0) +31)) (70) +81))? Let B(1), 2)}, B= {01), 0)} be two orthonormal bases for C. Construct an orthonormal basis for C4?
-
What did Lennox gain by integrating their WMS, TMS, and labor management systems?
-
A small lawnmower company produced 1,500 lawnmowers in 2005.In an effort to determine how maintenance-free these units were, the company decided to conduct a multiyear study of the 2005 lawnmowers. A...
-
A study of pollutants showed that certain industrial emissions should not exceed 2.5 parts per million. You believe a particular company may be exceeding this average. To test this supposition, you...
-
Test the following hypotheses by using the given sample information and = .05. Assume the populations are normally distributed. H0: 21 = 22 .......Ha: 21 22 n1 = 5, ....... n2 = 19, .......s1 =...
-
Consider the MOSFET class-AB output stage in Figure 8.26. The parameters are: \(V_{D D}=10 \mathrm{~V}\) and \(R_{L}=100 \Omega\). For transistors \(M_{n}\) and \(M_{p}, V_{T N}=\) \(-V_{T P}=1...
-
An enhancement-mode MOSFET class-AB output stage is shown in Figure P8.29. The threshold voltage of each transistor is \(V_{T N}=-V_{T P}=1 \mathrm{~V}\) and the conduction parameters of the output...
-
For the inductively coupled amplifier in Figure 8.28(a), the parameters are: \(V_{C C}=15 \mathrm{~V}, R_{E}=0.1 \mathrm{k} \Omega\), and \(R_{L}=1 \mathrm{k} \Omega\). The transistor parameters are...

Study smarter with the SolutionInn App