

Question: Study Tools ns ess Tips ess Tips R YOU Tools nciples of back Homework: Supply and Demand: Theory (Ch 03) 4. Individual and market supply
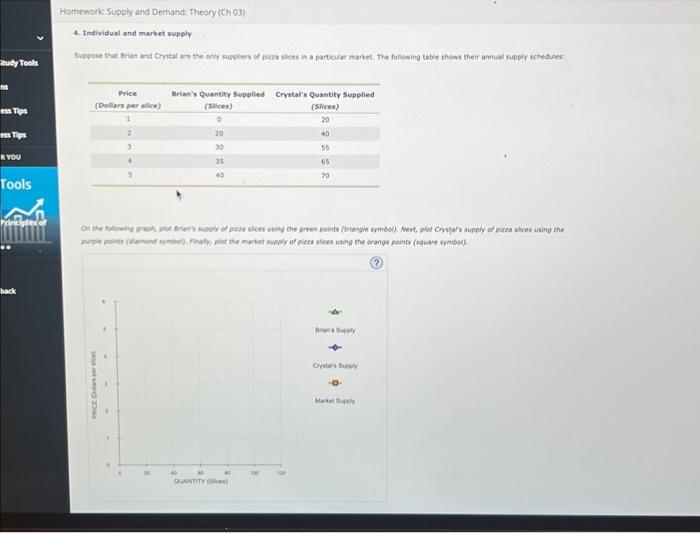
Study Tools ns ess Tips ess Tips R YOU Tools nciples of back Homework: Supply and Demand: Theory (Ch 03) 4. Individual and market supply Suppose that Brian and Crystal are the only suppliers of pizza slices in a particular market. The following table shows their annual supply schedules: Price (Dollars per slice) 1 2 3 PRICE (Dollars per slice) 5 12 1 0 4 0 5 Brian's Quantity Supplied Crystal's Quantity Supplied (Slices) (Slices) 0 20 On the following graph, plot Brian's supply of pizza slices using the green points (triangle symbol). Next, plot Crystal's supply of pizza slices using the purple points (diamond symbol). Finally, plot the market supply of pizza slices using the orange points (square symbol). 20 40 20 60 30 35 40 80 QUANTITY (Slices) 100 40 55 65 120 70 Brian's Supply Crystal's Supply Market Supply
4. Ineividual and market supply
Step by Step Solution
There are 3 Steps involved in it
1 Expert Approved Answer
Step: 1 Unlock

Question Has Been Solved by an Expert!
Get step-by-step solutions from verified subject matter experts
Step: 2 Unlock
Step: 3 Unlock