

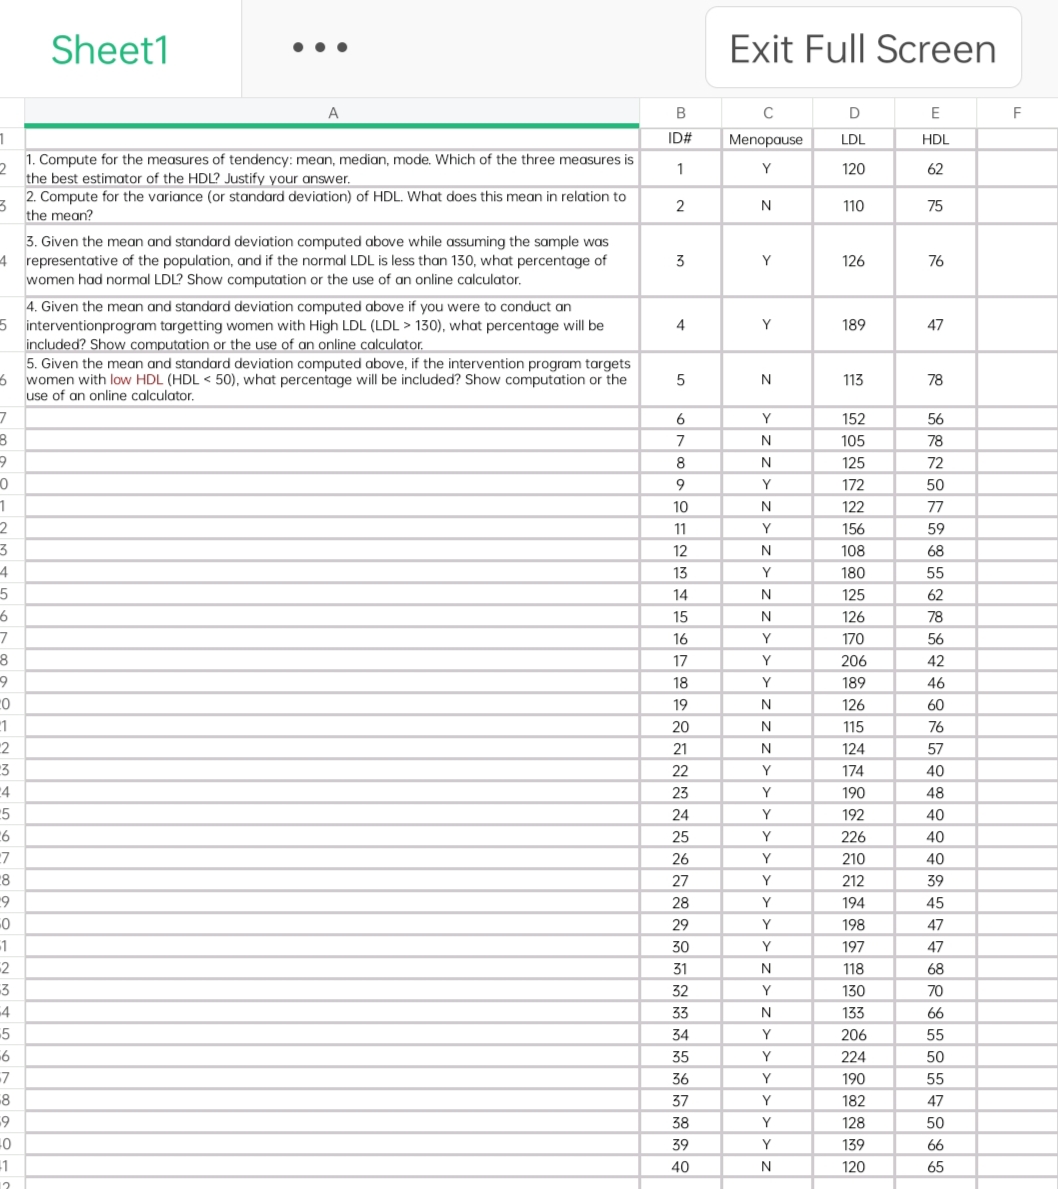
Question: Subj: Data Analysis Topic : Descriptive Analytics Sheet1 Exit Full Screen B E ID# Menopause LDL HDL 1. Compute for the measures of tendency: mean,
Subj: Data Analysis
Topic : Descriptive Analytics

Sheet1 Exit Full Screen B E ID# Menopause LDL HDL 1. Compute for the measures of tendency: mean, median, mode. Which of the three measures is 1 Y 120 62 the best estimator of the HDL? Justify your answer. 2. Compute for the variance (or standard deviation) of HDL. What does this mean in relation to N 110 75 N the mean? 3. Given the mean and standard deviation computed above while assuming the sample was 126 76 representative of the population, and if the normal LDL is less than 130, what percentage of women had normal LDL? Show computation or the use of an online calculator. 4. Given the mean and standard deviation computed above if you were to conduct an 4 189 47 interventionprogram targetting women with High LDL (LDL > 130), what percentage will be included? Show computation or the use of an online calculator. 5. Given the mean and standard deviation computed above, if the intervention program targets N 113 78 U women with low HDL (HDL
Step by Step Solution
There are 3 Steps involved in it

Get step-by-step solutions from verified subject matter experts