

Question: subject :decision analysis use excel Exercise 2. The company ABC is one of the most important specialists in electronic products. In the last weeks there
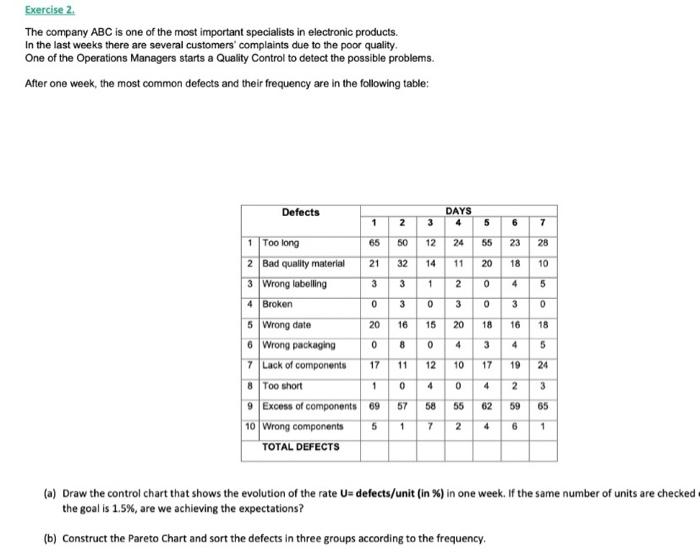
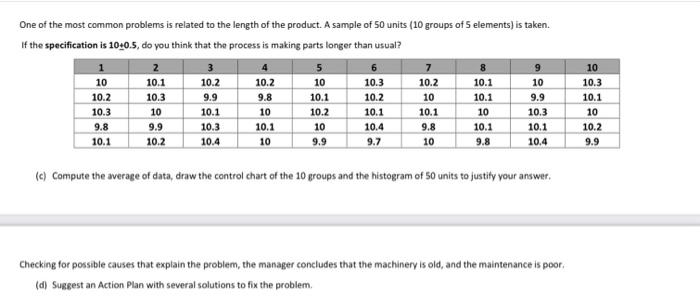
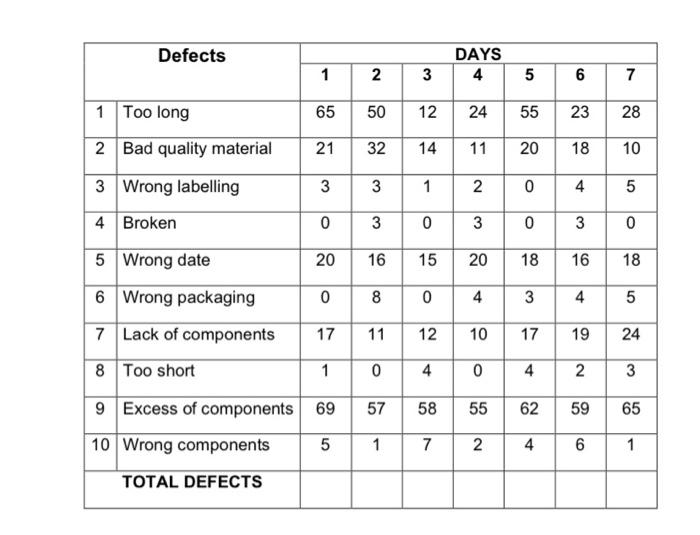


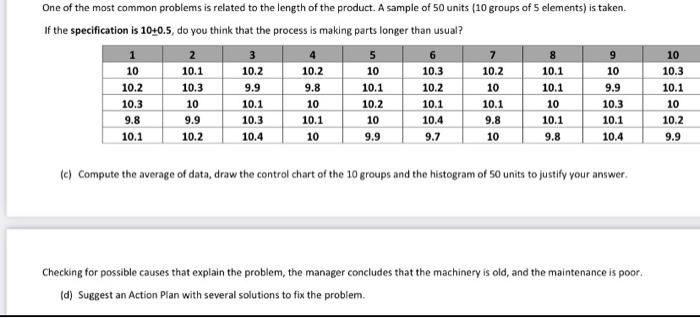
The company ABC is one of the most important specialists in electronic products. In the last weeks there are several customers' complaints due to the poor quality. One of the Operations Managers starts a Quality Control to detect the possible problems. After one week, the most common defects and their frequency are in the following table: (a) Draw the control chart that shows the evolution of the rate U= defects/unit (in % ) in one week. If the same number of units are checked the goal is 1.5%, are we achieving the expectations? (b) Construct the Pareto Chart and sort the defects in three groups according to the frequency. One of the most common problems is related to the length of the product. A sample of 50 units (10 groups of 5 elements) is taken. If the specification is 100.5, do you think that the process is making parts longer than usual? (c) Compute the average of data, draw the control chart of the 10 groups and the histogram of 50 units to justify your answer. Checking for possible causes that explain the problem, the manager concludes that the machinery is old, and the maintenance is poor. (d) Suggest an Action Plan with several solutions to fix the problem. \begin{tabular}{|c|l|c|c|c|c|c|c|c|} \hline \multicolumn{2}{|c|}{ Defects } & \multicolumn{7}{|c|}{ DAYS } \\ \cline { 2 - 8 } \multicolumn{2}{|c|}{} & 1 & 2 & 3 & 4 & 5 & 6 & 7 \\ \hline 1 & Too long & 65 & 50 & 12 & 24 & 55 & 23 & 28 \\ \hline 2 & Bad quality material & 21 & 32 & 14 & 11 & 20 & 18 & 10 \\ \hline 3 & Wrong labelling & 3 & 3 & 1 & 2 & 0 & 4 & 5 \\ \hline 4 & Broken & 0 & 3 & 0 & 3 & 0 & 3 & 0 \\ \hline 5 & Wrong date & 20 & 16 & 15 & 20 & 18 & 16 & 18 \\ \hline 6 & Wrong packaging & 0 & 8 & 0 & 4 & 3 & 4 & 5 \\ \hline 7 & Lack of components & 17 & 11 & 12 & 10 & 17 & 19 & 24 \\ \hline 8 & Too short & 1 & 0 & 4 & 0 & 4 & 2 & 3 \\ \hline 9 & Excess of components & 69 & 57 & 58 & 55 & 62 & 59 & 65 \\ \hline 10 & Wrong components & 5 & 1 & 7 & 2 & 4 & 6 & 1 \\ \hline \end{tabular} One of the most common problems is related to the length of the product. A sample of 50 units (10 groups of 5 elements) is taken. If the specification is 100.5, do you think that the process is making parts longer than usual? (c) Compute the average of data, draw the control chart of the 10 groups and the histogram of 50 units to justify your answer. Checking for possible causes that explain the problem, the manager concludes that the machinery is old, and the maintenance is poor. (d) Suggest an Action Plan with several solutions to fix the problem. The company ABC is one of the most important specialists in electronic products. In the last weeks there are several customers' complaints due to the poor quality. One of the Operations Managers starts a Quality Control to detect the possible problems. After one week, the most common defects and their frequency are in the following table: (a) Draw the control chart that shows the evolution of the rate U= defects/unit (in % ) in one week. If the same number of units are checked the goal is 1.5%, are we achieving the expectations? (b) Construct the Pareto Chart and sort the defects in three groups according to the frequency. One of the most common problems is related to the length of the product. A sample of 50 units (10 groups of 5 elements) is taken. If the specification is 100.5, do you think that the process is making parts longer than usual? (c) Compute the average of data, draw the control chart of the 10 groups and the histogram of 50 units to justify your answer. Checking for possible causes that explain the problem, the manager concludes that the machinery is old, and the maintenance is poor. (d) Suggest an Action Plan with several solutions to fix the problem. \begin{tabular}{|c|l|c|c|c|c|c|c|c|} \hline \multicolumn{2}{|c|}{ Defects } & \multicolumn{7}{|c|}{ DAYS } \\ \cline { 2 - 8 } \multicolumn{2}{|c|}{} & 1 & 2 & 3 & 4 & 5 & 6 & 7 \\ \hline 1 & Too long & 65 & 50 & 12 & 24 & 55 & 23 & 28 \\ \hline 2 & Bad quality material & 21 & 32 & 14 & 11 & 20 & 18 & 10 \\ \hline 3 & Wrong labelling & 3 & 3 & 1 & 2 & 0 & 4 & 5 \\ \hline 4 & Broken & 0 & 3 & 0 & 3 & 0 & 3 & 0 \\ \hline 5 & Wrong date & 20 & 16 & 15 & 20 & 18 & 16 & 18 \\ \hline 6 & Wrong packaging & 0 & 8 & 0 & 4 & 3 & 4 & 5 \\ \hline 7 & Lack of components & 17 & 11 & 12 & 10 & 17 & 19 & 24 \\ \hline 8 & Too short & 1 & 0 & 4 & 0 & 4 & 2 & 3 \\ \hline 9 & Excess of components & 69 & 57 & 58 & 55 & 62 & 59 & 65 \\ \hline 10 & Wrong components & 5 & 1 & 7 & 2 & 4 & 6 & 1 \\ \hline \end{tabular} One of the most common problems is related to the length of the product. A sample of 50 units (10 groups of 5 elements) is taken. If the specification is 100.5, do you think that the process is making parts longer than usual? (c) Compute the average of data, draw the control chart of the 10 groups and the histogram of 50 units to justify your answer. Checking for possible causes that explain the problem, the manager concludes that the machinery is old, and the maintenance is poor. (d) Suggest an Action Plan with several solutions to fix the
Step by Step Solution
There are 3 Steps involved in it

Get step-by-step solutions from verified subject matter experts