

Question: Subject: Digital Image Processing Qno 2: a) The transformation map plot below depicts various curves that fall under the Power Law Transformation. output - c.input,
Subject: Digital Image Processing
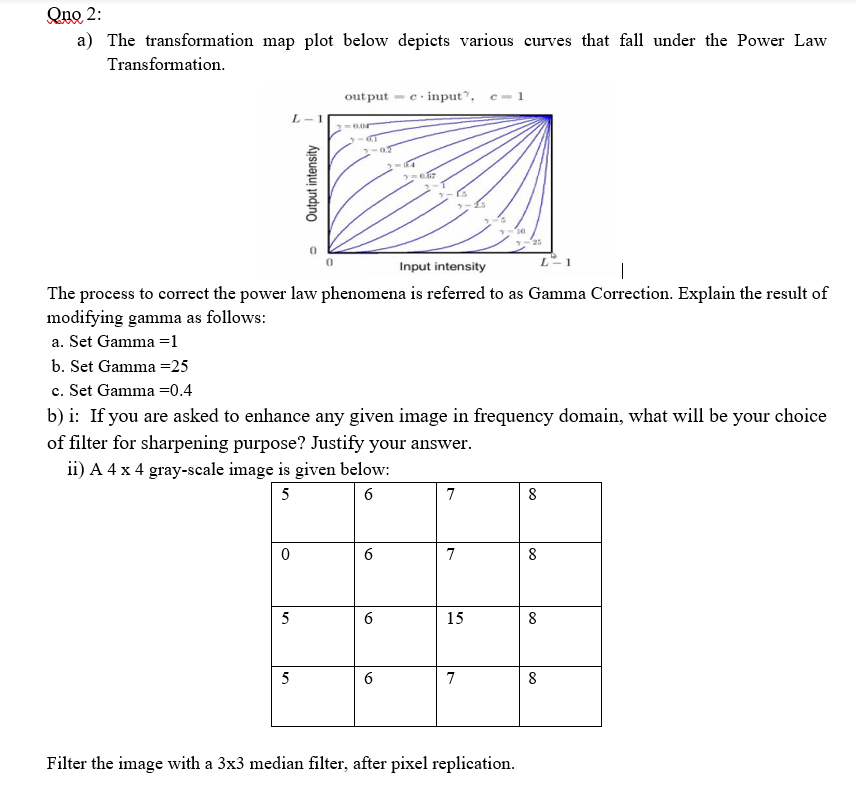
Qno 2: a) The transformation map plot below depicts various curves that fall under the Power Law Transformation. output - c.input", c-1 L-1 Output intensity Input intensity The process to correct the power law phenomena is referred to as Gamma Correction. Explain the result of modifying gamma as follows: a. Set Gamma =1 b. Set Gamma =25 c. Set Gamma=0.4 b)i: If you are asked to enhance any given image in frequency domain, what will be your choice of filter for sharpening purpose? Justify your answer. ii) A 4 x 4 gray-scale image is given below: 5 6 8 7 0 6 7 8 5 6 15 8 5 6 7 8 Filter the image with a 3x3 median filter, after pixel replication. Qno 2: a) The transformation map plot below depicts various curves that fall under the Power Law Transformation. output - c.input", c-1 L-1 Output intensity Input intensity The process to correct the power law phenomena is referred to as Gamma Correction. Explain the result of modifying gamma as follows: a. Set Gamma =1 b. Set Gamma =25 c. Set Gamma=0.4 b)i: If you are asked to enhance any given image in frequency domain, what will be your choice of filter for sharpening purpose? Justify your answer. ii) A 4 x 4 gray-scale image is given below: 5 6 8 7 0 6 7 8 5 6 15 8 5 6 7 8 Filter the image with a 3x3 median filter, after pixel replication
Step by Step Solution
There are 3 Steps involved in it

Get step-by-step solutions from verified subject matter experts