

Question: Subject: Engineering Data Analysis 1. The data below shows the mass of 40 students in a class. The measurement is to the nearest kg. (10
Subject: Engineering Data Analysis

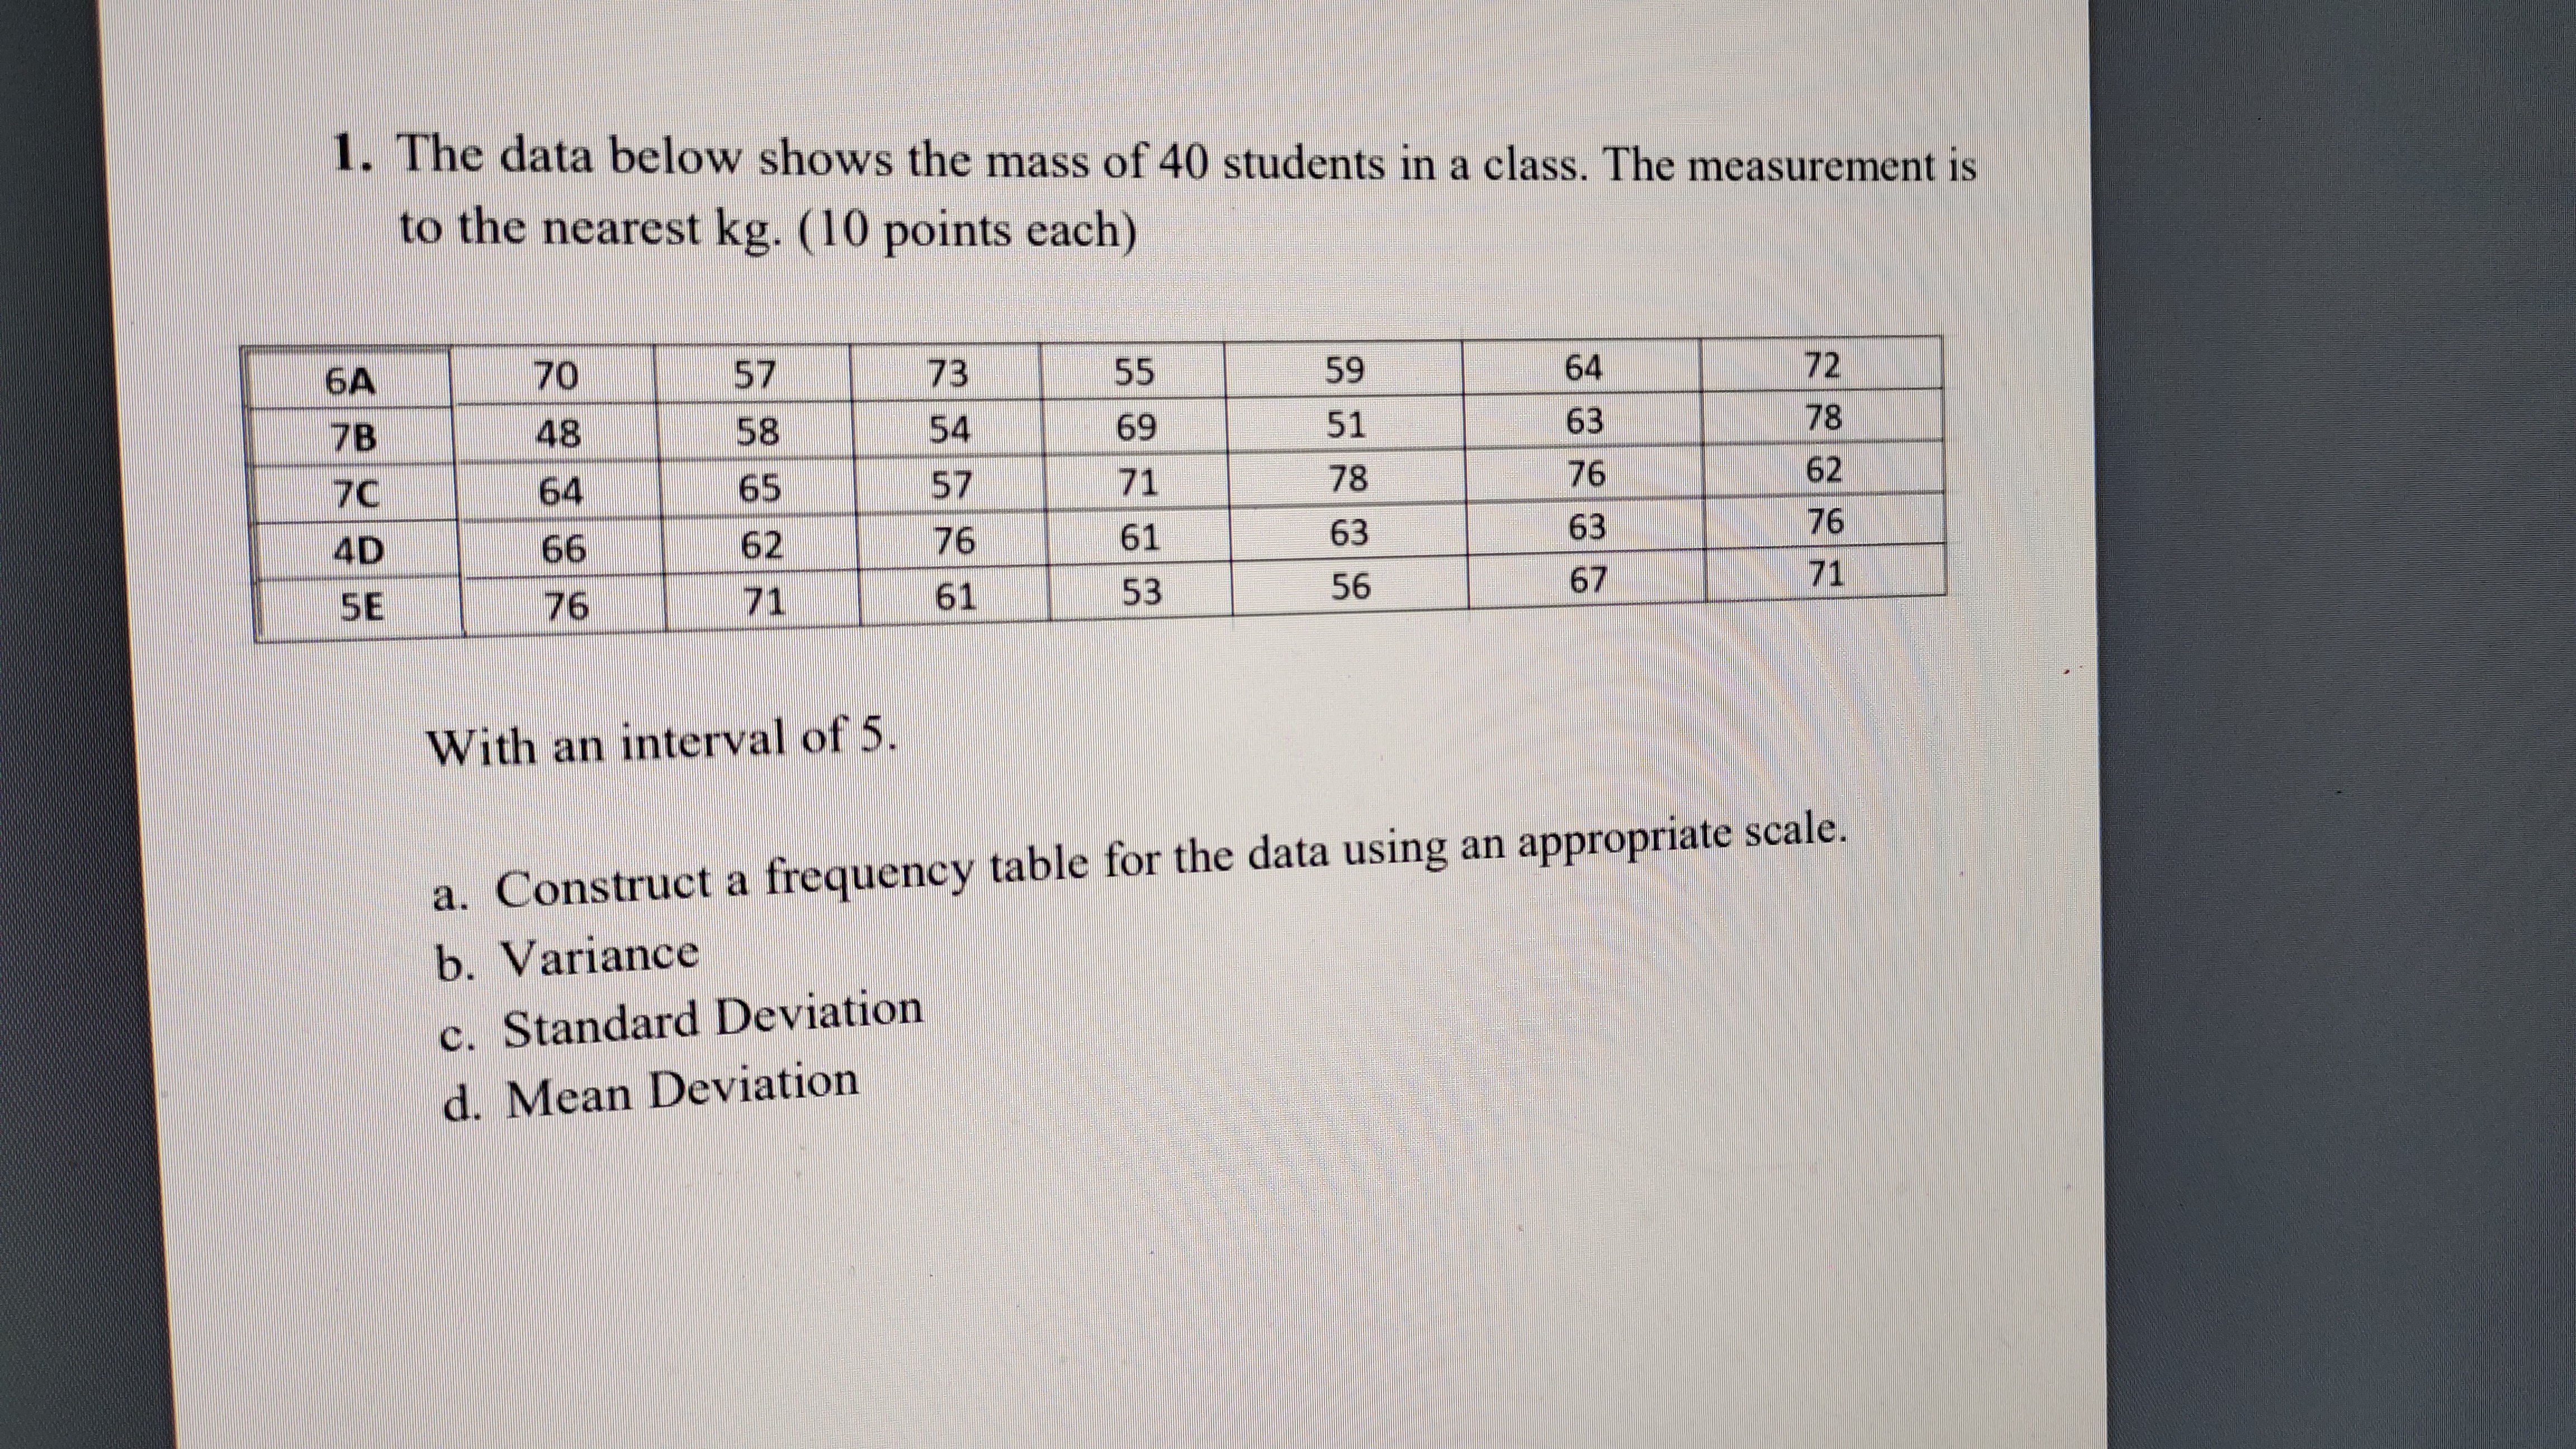
1. The data below shows the mass of 40 students in a class. The measurement is to the nearest kg. (10 points each) 6A 70 57 73 55 59 64 72 7B 48 58 54 69 51 63 78 70 64 65 57 71 78 76 62 4D 66 62 76 61 63 63 76 5E 76 71 61 53 56 67 71 With an interval of 5. a. Construct a frequency table for the data using an appropriate scale. b. Variance c. Standard Deviation d. Mean Deviation
Step by Step Solution
There are 3 Steps involved in it
1 Expert Approved Answer
Step: 1 Unlock

Question Has Been Solved by an Expert!
Get step-by-step solutions from verified subject matter experts
Step: 2 Unlock
Step: 3 Unlock