

Question: Subject: Probability and Statistics *** Topics: Random Sampling Techniques, Parameter and Statistic, Sampling Distribution and Sampling Distribution of the Sample Mean. Direction: Choose the correct
Subject: Probability and Statistics
***
Topics: Random Sampling Techniques, Parameter and Statistic, Sampling Distribution and Sampling Distribution of the Sample Mean.
Direction: Choose the correct answer for the following questions:
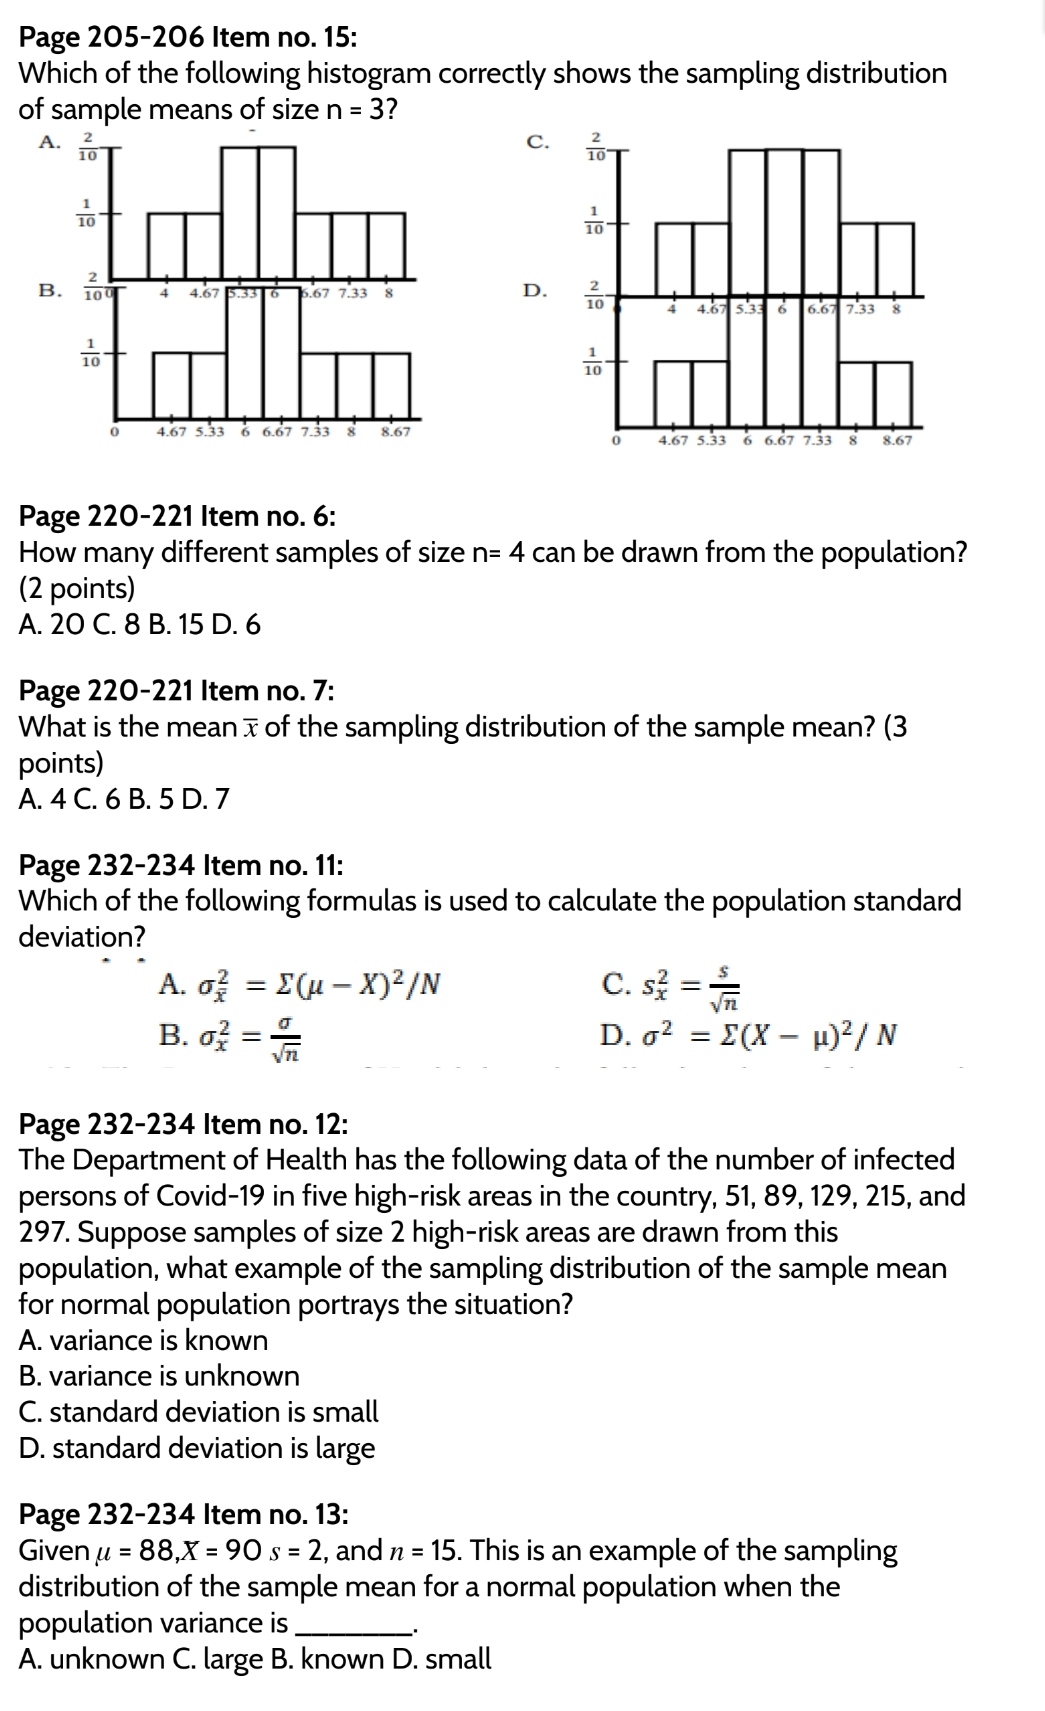
Page 179-180 Item no. 5: Which of the following is NOT a type of random sampling? A. cluster C. simple B. purposive D. systematic Page 179-180 Item no. 6: Which of the following is random sampling? A. convenience C. purposive B. non-probability D. stratified Page 193-194 Item no. I: What do you call a number that describes a sample characteristic? A. data C. sample B. parameter D. statistic Page 193-194 Item no. 2: What do you call a number that describes a population characteristic? A. data C. sample B. parameter D. statistic Page 193-194 Item no. 3: Which of the following is a statistic? A.0'2C.GB.pD.S Page 193-194 Item no. 4: For numbers 46, the following are scores of students in their quiz: 7, 11. 8, 8, 19,15. 7, 9. 9. 20. 17. 14 What is the value of p? (2 points) A. 10.4 C. 12 B. 11 D. 14.4 Page 205-206 Item no. 10: For numbers 10-15. refer to the following population consists of the data {2,4, 6. 8. 10}. How many different samples of size n = 3 can be drawn from the population? A.6B.8C.10D.12 Page 205-206 Item no. 11: Which of the following sample mean appears most frequent in the sampling distribution? A. 3.67 B. 4 C. 4.67 D. 6 Page 205-206 Item no. 14: What is the probability of the sample mean 5.33 in the sampling distribution of the sample mean? Page 205-206 Item no. 15: Which of the following histogram correctly shows the sampling distribution of sample means of size n = 3? C. BIN sl- B. .67 7.33 a D. SIN .. .. al 0 467 533 6 61\" 7'33 8 \"'67 0 4.67 5.33 6 b? 7.33 B 8.67 Page 220-221 Item no. 6: How many different samples of size n= 4 can be drawn from the population? (2 points) A.20C.BB.15 D.6 Page 220-221 Item no. 7: What is the mean 3 of the sampling distribution of the sample mean? (3 points) A.4C.6B.5D.7 Page 232-234 Item no. 11: Which of the following formulas is used to calculate the population standard deviation? 9 a an; =(.uX)2/N C. 52 =37: 3.51? 2.7; D. a? =sur mini Page 232-234 Item no. 12: The Department of Health has the following data of the number of infected persons of Covid-19 in five high-risk areas in the country. 51. B9. 129, 215, and 297. Suppose samples of size 2 high-risk areas are drawn from this population. what example of the sampling distribution of the sample mean for normal population portrays the situation? A. variance is known B. variance is unknown C. standard deviation is small D. standard deviation is large Page 232-234 Item no. 13: Given .1; = 88,X= 90 s = 2, and n = 15. This is an example of the sampling distribution of the sample mean for a normal population when the population variance is A. unknown C. large B. known D. small Page 232-234 Item no. 14: A researcher used to develop a problem-solving test to randomly selected 100 Grade 11 students. From this sample, the mean and standard deviation is 90 and 4 respectively. The mean of the population is 88. The researcher is in a situation of the sampling distribution of the sample mean wherein the population variance is . A. unknown C. large B. known D. small Page 247-248 Item no. 2: The Central Limit Theorem states that: A. the sample size is large. B. all possible samples are selected. C. the standard error of the sampling distribution is small. D. the standard deviation is sufficiently large than the normal Page 247-248 Item no. 3: The Central Limit Theorem states that the mean of the sampling distribution of the sample mean is A. larger than the population mean. B. exactly equal to the population mean. C. equal to the population mean divided by the square root of the sample Size. D. close to the population means if the sample size is large. Page 263-265 Item no. 3: For numbers 1 - 4. refer to the problem below. Suppose that a random sample of size 64 is to be selected from a population with a mean 40 and standard deviation 5. What is the approximate probability that i will be within 0.5 of the population mean p? A. 31.5% B. 32.80% C. 57.62% D. 75.57% Page 263-265 Item no. 4: What is the approximate probability that 3 will differ from ,u by more than 0.7? A. 26.27% B. 34.23% C. 39.3% D. 40.7%
Step by Step Solution
There are 3 Steps involved in it

Get step-by-step solutions from verified subject matter experts