

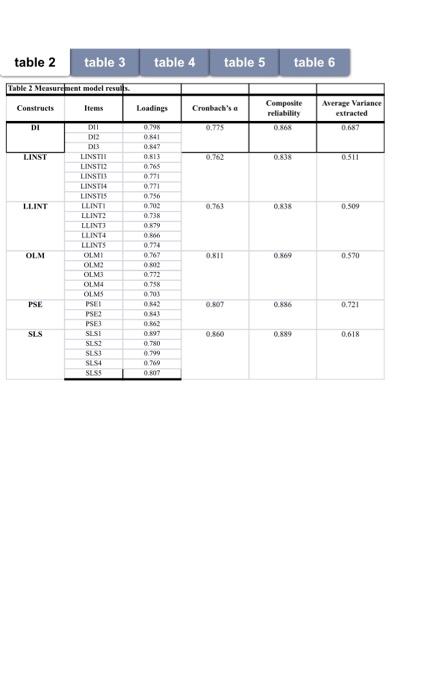
Question: Subject: Research Project Requirement:Interpret the following table Supporting Document: table 4 table 5 table 6 table 2 table 3 Table 2 Measurement model results Constructs
Subject: Research Project
Requirement:Interpret the following table
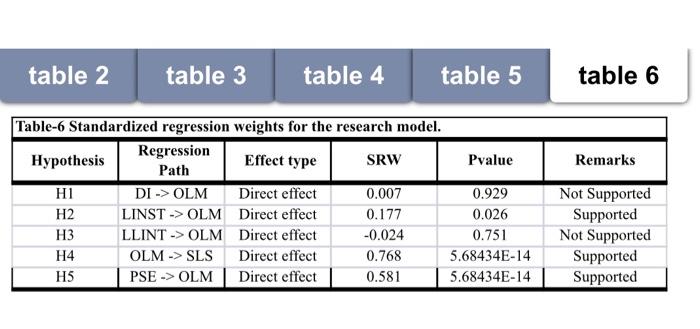
Supporting Document:
Step by Step Solution
There are 3 Steps involved in it
1 Expert Approved Answer
Step: 1 Unlock

Question Has Been Solved by an Expert!
Get step-by-step solutions from verified subject matter experts
Step: 2 Unlock
Step: 3 Unlock