Question: Submit the excel example with all three strategies executed on them:one sheet with a chase strategy, one tab with a flexible strategy, and one tab
Submit the excel example with all three strategies executed on them:one sheet with a chase strategy, one tab with a flexible strategy, and one tab with a level strategy.
Sales and Operations Planning Example(1) (2).xlsx
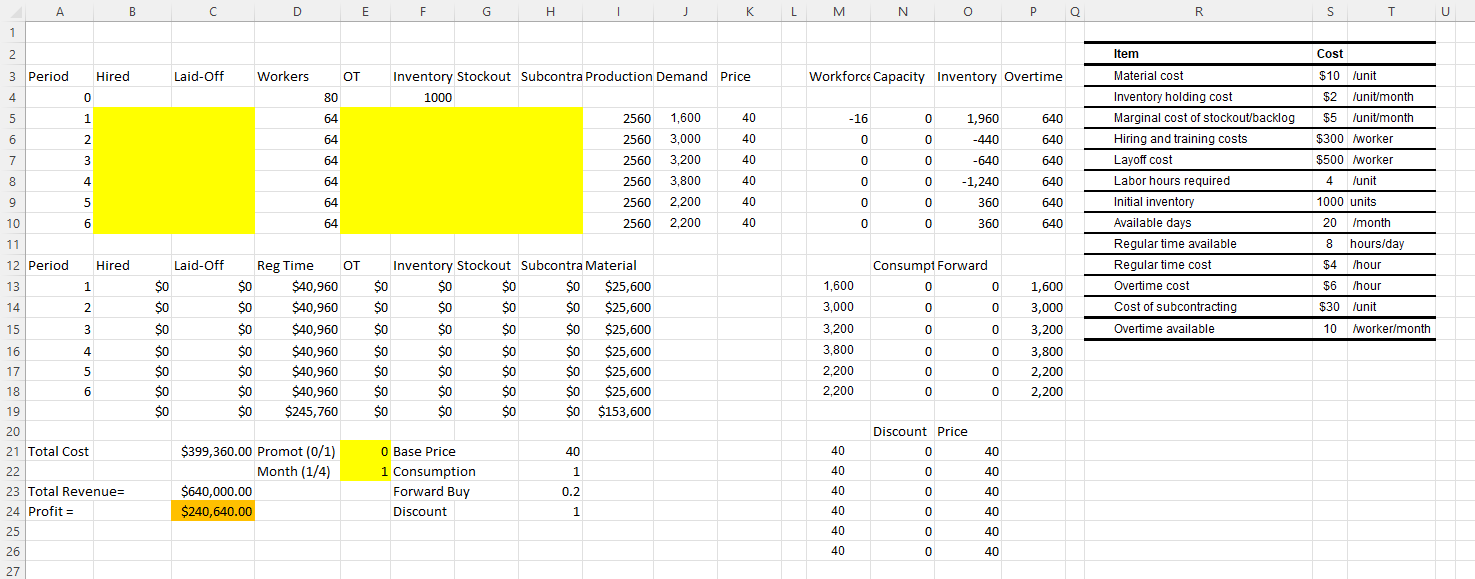
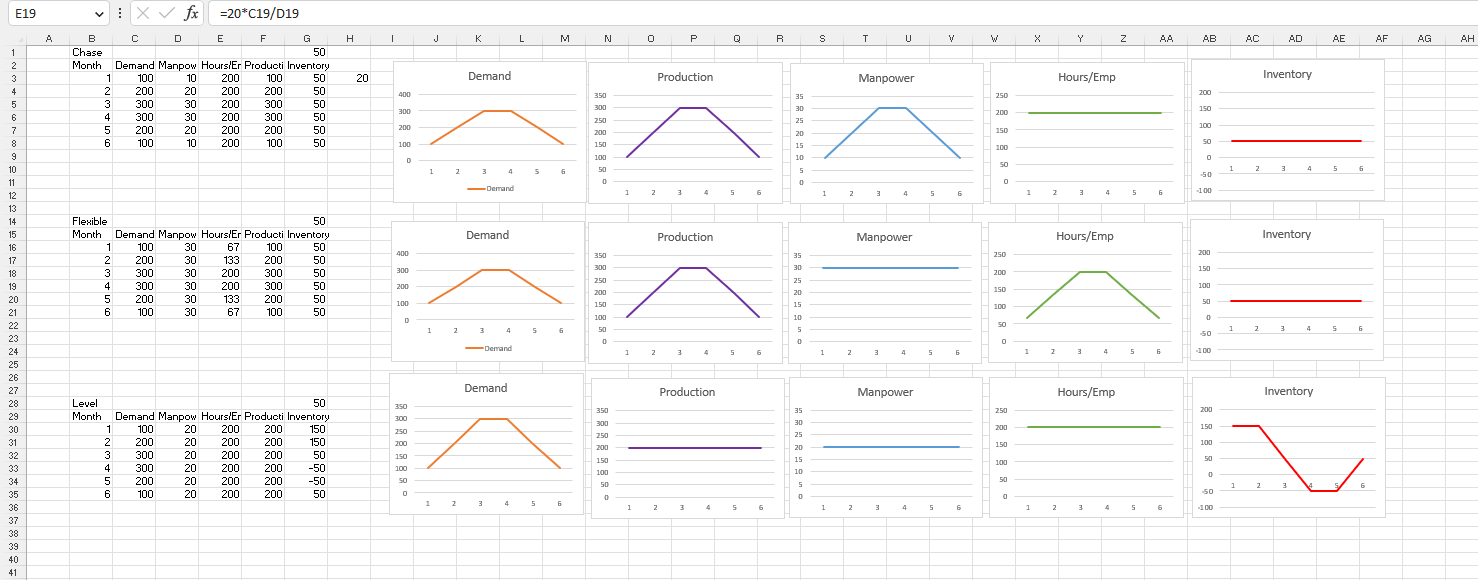
K L R A B C D E F G H J M N O P Q S T U N - Item Cost $10 /unit W Period Hired Laid-Off Workers OT Inventory Stockout Subcontra Production Demand Price Workforce Capacity Inventory Overtime Material cos 80 1000 Inventory holding cost $2 /unit/month O 64 2560 1,600 40 -16 1,960 640 Marginal cost of stockout/backlog /unit/month OUI A 64 2560 3,000 40 0 -440 640 Hiring and training costs $300 /worker 64 2560 3,200 40 0 640 640 Layoff cost $500 /worker 64 2560 3,800 40 0 -1,240 640 Labor hours required 4 /unit o o o 64 2560 2,200 40 360 640 Initial inventory 1000 units 10 64 2560 2,200 40 360 640 Available days 20 /month Regular time available 8 hours/day 54 /hour 12 Period Hired Laid-Off Reg Time OT Inventory Stockout Subcontra Material Consumpi Forward Regular time cost $40,960 SO SO $25,600 1,600 1,600 Overtime cost 56 /hour OO 14 SO $0 $40,960 SO SO SO $25,600 3,000 3,000 Cost of subcontracting $30 /unit 10 /worker/month 15 SO SO $40,960 SO SO $0 $25,600 3,200 0 3,200 Overtime available 16 UP w SO SO $40,960 so so SO SO $25,600 3,800 o o O 3,800 17 SO SO $40,960 SO SO so SO $25,600 2,200 2,200 18 6 SO SO $40,960 So SO SO $O $25,600 2,200 2,200 19 SO so $245,760 SO So SO SO $153,600 20 Discount Price 21 Total Cost $399,360.00 Promot (0/1) 0 Base Price 40 40 40 22 Month (1/4) 1 Consumption 1 40 40 23 Total Revenue= $640,000.00 Forward Buy 0.2 40 40 oo oo oo 24 Profit = $240,640.00 Discount 1 40 40 25 40 40 26 40 40 27E19 v X V fx =20*C19/D19 W X Y Z AA AB AC AD AE AF AG AH V M N S U J 0 P R T K A B D E F G H Chase 5L Month Demand Manpow Hours/Er Producti Inventory Hours/Emp Inventory Demand Production Manpower 100 10 200 100 50 20 200 200 200 200 50 250 400 350 150 300 200 300 50 ODE 200 300 300 200 300 50 250 100 150 200 200 200 50 200 200 50 100 100 200 100 50 100 150 100 05 1 3 4 5 50 1 2 3 4 1 3 4 5 -100 -Demand 2 3 5 1 2 2 Flexible 50 Inventory Demand Production Manpower Hours/Emp Month Demand Manpow Hours/Er Producti Inventory 67 250 200 100 100 350 150 20 13' 200 DOE 200 300 ODE 100 189898 250 150 98 8888 200 300 200 200 50 133 200 100 100 150 100 67 100 100 50 50 1 2 3 4 5 1 2 3 4 S 1.00 -Demand 1 2 3 4 5 1 2 4 5 1 2 3 4 5 Inventory Demand Production Manpower Hours/Emp 50 35 250 200 Level 350 350 150 Month Demand Manpow Hours/Er Producti Inventory OCE 300 30 200 100 200 200 250 250 25 100 150 200 200 200 200 20 50 200 200 150 150 15 100 200 100 100 10 200 50 200 50 50 5 50 200 200 100 200 200 -1 00 1 2 3 4 5 6 1 2 4 5 2
Step by Step Solution
There are 3 Steps involved in it
1 Expert Approved Answer
Step: 1 Unlock
Question Has Been Solved by an Expert!
Get step-by-step solutions from verified subject matter experts
Step: 2 Unlock
Step: 3 Unlock
Students Have Also Explored These Related Accounting Questions!