

Question: Sub-questions (a) Use the data provided in the above check sheet to construct a Pareto chart* for the defects detected over the 7-days period. The
Sub-questions
(a) Use the data provided in the above check sheet to construct a Pareto chart* for the defects detected over the 7-days period. The Pareto chart should include a bar chart displaying the count of defects and a line chart depicting the cumulative percentage.
*You are suggested to use MS Excel to construct the Pareto chart and paste the chart onto your MS Word report. [There is no need to submit the MS Excel file]
(b) Based on the Pareto chart constructed in part (a), which issue(s) should
be resolved on high priority? Justify
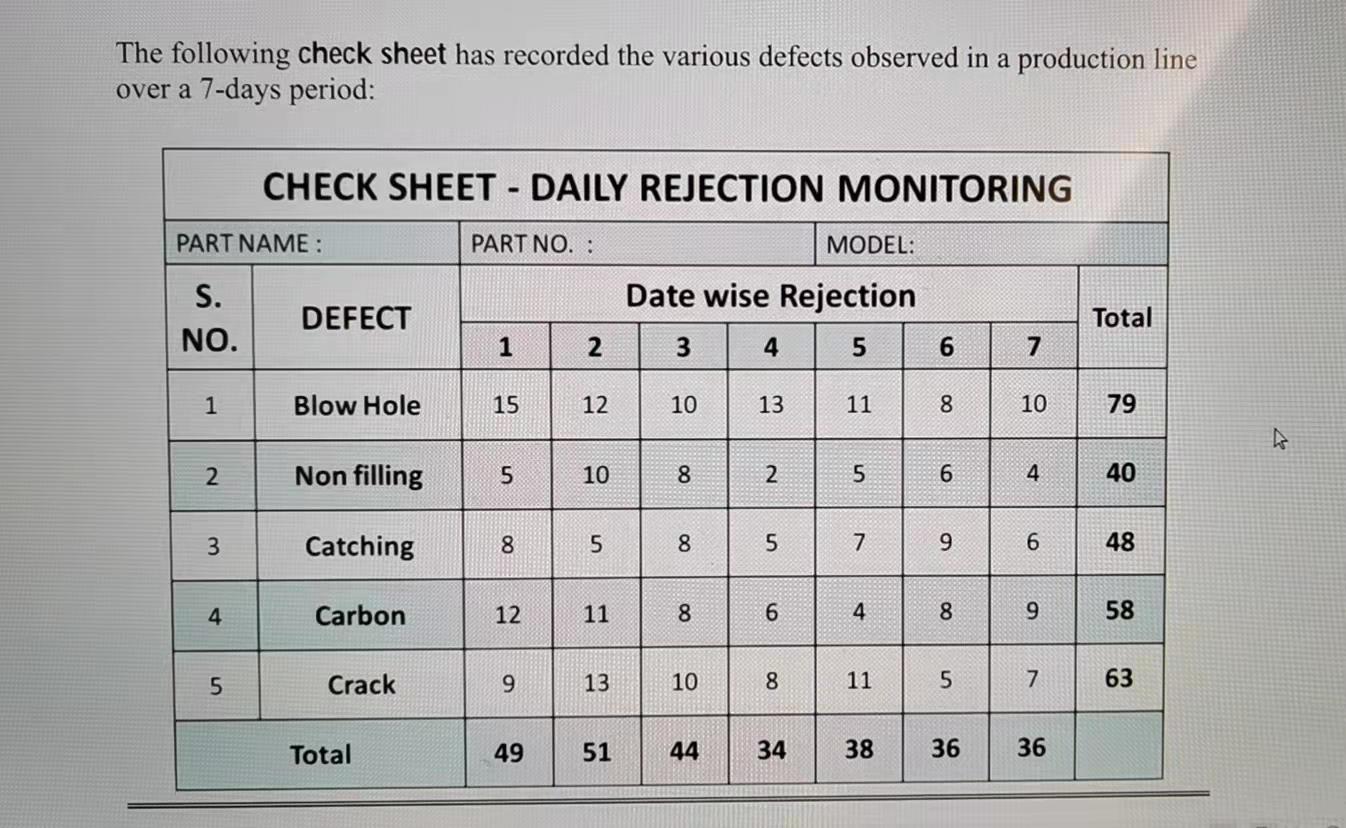
The following check sheet has recorded the various defects observed in a production line over a 7-days period: CHECK SHEET - DAILY REJECTION MONITORING - PART NAME: PART NO.: MODEL: S. NO. DEFECT Date wise Rejection 3 4 5 Total 1 2. 2 6 7 1 Blow Hole 15 12 10 13 11 00 8 10 79 2 Non filling 5 10 00 8 N 5 6 4 40 3 Catching 00 8 5 8 un 7 9 6 48 4 Carbon 12 11 8 00 6 4. 8 9 58 5 un Crack 9 13 10 8 11 5 7 63 Total 49 51 44 34 38 36 36Step by Step Solution
There are 3 Steps involved in it
1 Expert Approved Answer
Step: 1 Unlock

Question Has Been Solved by an Expert!
Get step-by-step solutions from verified subject matter experts
Step: 2 Unlock
Step: 3 Unlock