

Question: Subscribers 6 Developing a Model 7 The number of New (Acquired) Subscribers (or the related acquisition spend) would typically be the input that drives the
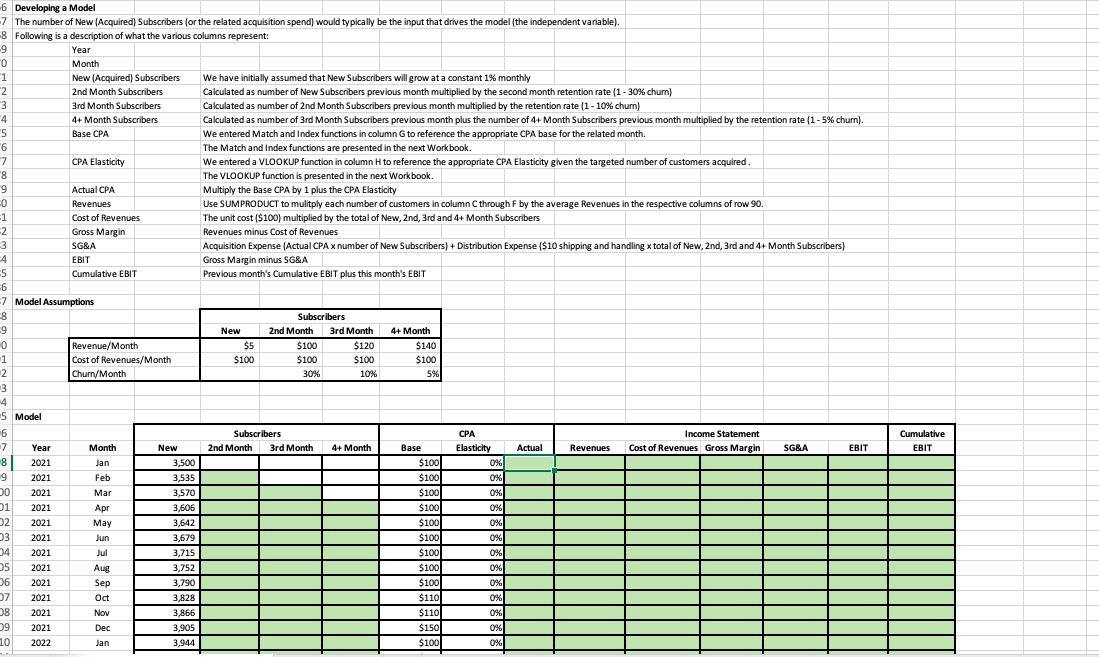
Subscribers 6 Developing a Model 7 The number of New (Acquired) Subscribers (or the related acquisition spend) would typically be the input that drives the model (the independent variable). 8 Following is a description of what the various columns represent: 9 Year "O Month 1 New (Acquired) Subscribers We have initially assumed that New Subscribers will grow at a constant 1% monthly 2 2nd Month Subscribers Calculated as number of New Subscribers previous month multiplied by the second month retention rate (1 - 30% churn) 3 3rd Month Subscribers Calculated as number of 2nd Month Subscribers previous month multiplied by the retention rate (1 - 10% churn) 4 4+ Month Subscribers Calculated as number of 3rd Month Subscribers previous month plus the number of 4+ Month Subscribers previous month multiplied by the retention rate (1-5% churn). "5 Base CPA We entered Match and Index functions in column G to reference the appropriate CPA base for the related month. 6 The Match and Index functions are presented in the next Workbook. 7 CPA Elasticity We entered a VLOOKUP function in column H to reference the appropriate CPA Elasticity given the targeted number of customers acquired 8 The VLOOKUP function is presented in the next Workbook. 9 Actual CPA Multiply the Base CPA by 1 plus the CPA Elasticity -0 Revenues Use SUMPRODUCT to mulitply each number of customers in column C through F by the average Revenues in the respective columns of row 90 -1 Cost of Revenues The unit cost ($100) multiplied by the total of New, 2nd, 3rd and 4+ Month Subscribers -2 Gross Margin Revenues minus Cost of Revenues 3 SG&A Acquisition Expense (Actual CPA x number of New Subscribers) + Distribution Expense ($10 shipping and handling x total of New, 2nd, 3rd and 4+ Month Subscribers) 4 EBIT Gross Margin minus SG&A -5 5 Cumulative EBIT Previous month's Cumulative EBIT plus this month's EBIT -6 -7 Model Assumptions 8 -9 New 2nd Month 3rd Month 4+ Month 0 Revenue/Month $5 $100 $120 $140 1 Cost of Revenues/Month $100 $100 $100 $100 2 Churn/Month 30% 10% 5% 3 4 5 5 Model 6 Subscribers CPA Income Statement 7 Month New 2nd Month 3rd Month 4+ Month Base Elasticity Actual Revenues Cost of Revenues Gross Margin SG&A EBIT 8 2021 Jan 3,500 $100 0% 9 9 2021 Feb 3,535 $100 0% 00 2021 Mar 3,570 $100 0 0% 01 2021 Apr 3,606 $100 0% 2 2021 May 3,642 $100 0% 03 2021 Jun 3,679 $100 0% 34 2021 Jul 3,715 $100 0% 05 2021 Aug 3,752 $100 0% 06 2021 Sep 3,790 $100 0% 07 2021 Oct 3,828 $110 0% 08 2021 Nov 3,866 $110 0% 0% 09 2021 Dec 3,905 $150 % 0% 10 2022 Jan 3,944 $1001 0% Cumulative EBIT Year Subscribers 6 Developing a Model 7 The number of New (Acquired) Subscribers (or the related acquisition spend) would typically be the input that drives the model (the independent variable). 8 Following is a description of what the various columns represent: 9 Year "O Month 1 New (Acquired) Subscribers We have initially assumed that New Subscribers will grow at a constant 1% monthly 2 2nd Month Subscribers Calculated as number of New Subscribers previous month multiplied by the second month retention rate (1 - 30% churn) 3 3rd Month Subscribers Calculated as number of 2nd Month Subscribers previous month multiplied by the retention rate (1 - 10% churn) 4 4+ Month Subscribers Calculated as number of 3rd Month Subscribers previous month plus the number of 4+ Month Subscribers previous month multiplied by the retention rate (1-5% churn). "5 Base CPA We entered Match and Index functions in column G to reference the appropriate CPA base for the related month. 6 The Match and Index functions are presented in the next Workbook. 7 CPA Elasticity We entered a VLOOKUP function in column H to reference the appropriate CPA Elasticity given the targeted number of customers acquired 8 The VLOOKUP function is presented in the next Workbook. 9 Actual CPA Multiply the Base CPA by 1 plus the CPA Elasticity -0 Revenues Use SUMPRODUCT to mulitply each number of customers in column C through F by the average Revenues in the respective columns of row 90 -1 Cost of Revenues The unit cost ($100) multiplied by the total of New, 2nd, 3rd and 4+ Month Subscribers -2 Gross Margin Revenues minus Cost of Revenues 3 SG&A Acquisition Expense (Actual CPA x number of New Subscribers) + Distribution Expense ($10 shipping and handling x total of New, 2nd, 3rd and 4+ Month Subscribers) 4 EBIT Gross Margin minus SG&A -5 5 Cumulative EBIT Previous month's Cumulative EBIT plus this month's EBIT -6 -7 Model Assumptions 8 -9 New 2nd Month 3rd Month 4+ Month 0 Revenue/Month $5 $100 $120 $140 1 Cost of Revenues/Month $100 $100 $100 $100 2 Churn/Month 30% 10% 5% 3 4 5 5 Model 6 Subscribers CPA Income Statement 7 Month New 2nd Month 3rd Month 4+ Month Base Elasticity Actual Revenues Cost of Revenues Gross Margin SG&A EBIT 8 2021 Jan 3,500 $100 0% 9 9 2021 Feb 3,535 $100 0% 00 2021 Mar 3,570 $100 0 0% 01 2021 Apr 3,606 $100 0% 2 2021 May 3,642 $100 0% 03 2021 Jun 3,679 $100 0% 34 2021 Jul 3,715 $100 0% 05 2021 Aug 3,752 $100 0% 06 2021 Sep 3,790 $100 0% 07 2021 Oct 3,828 $110 0% 08 2021 Nov 3,866 $110 0% 0% 09 2021 Dec 3,905 $150 % 0% 10 2022 Jan 3,944 $1001 0% Cumulative EBIT Year
Step by Step Solution
There are 3 Steps involved in it

Get step-by-step solutions from verified subject matter experts