

Question: SUbtIt Paragraph Styles Module 1 Minitab Assignment Instructions: Below you will find questions and a sample dataset. Please use the provided dataset to complete the
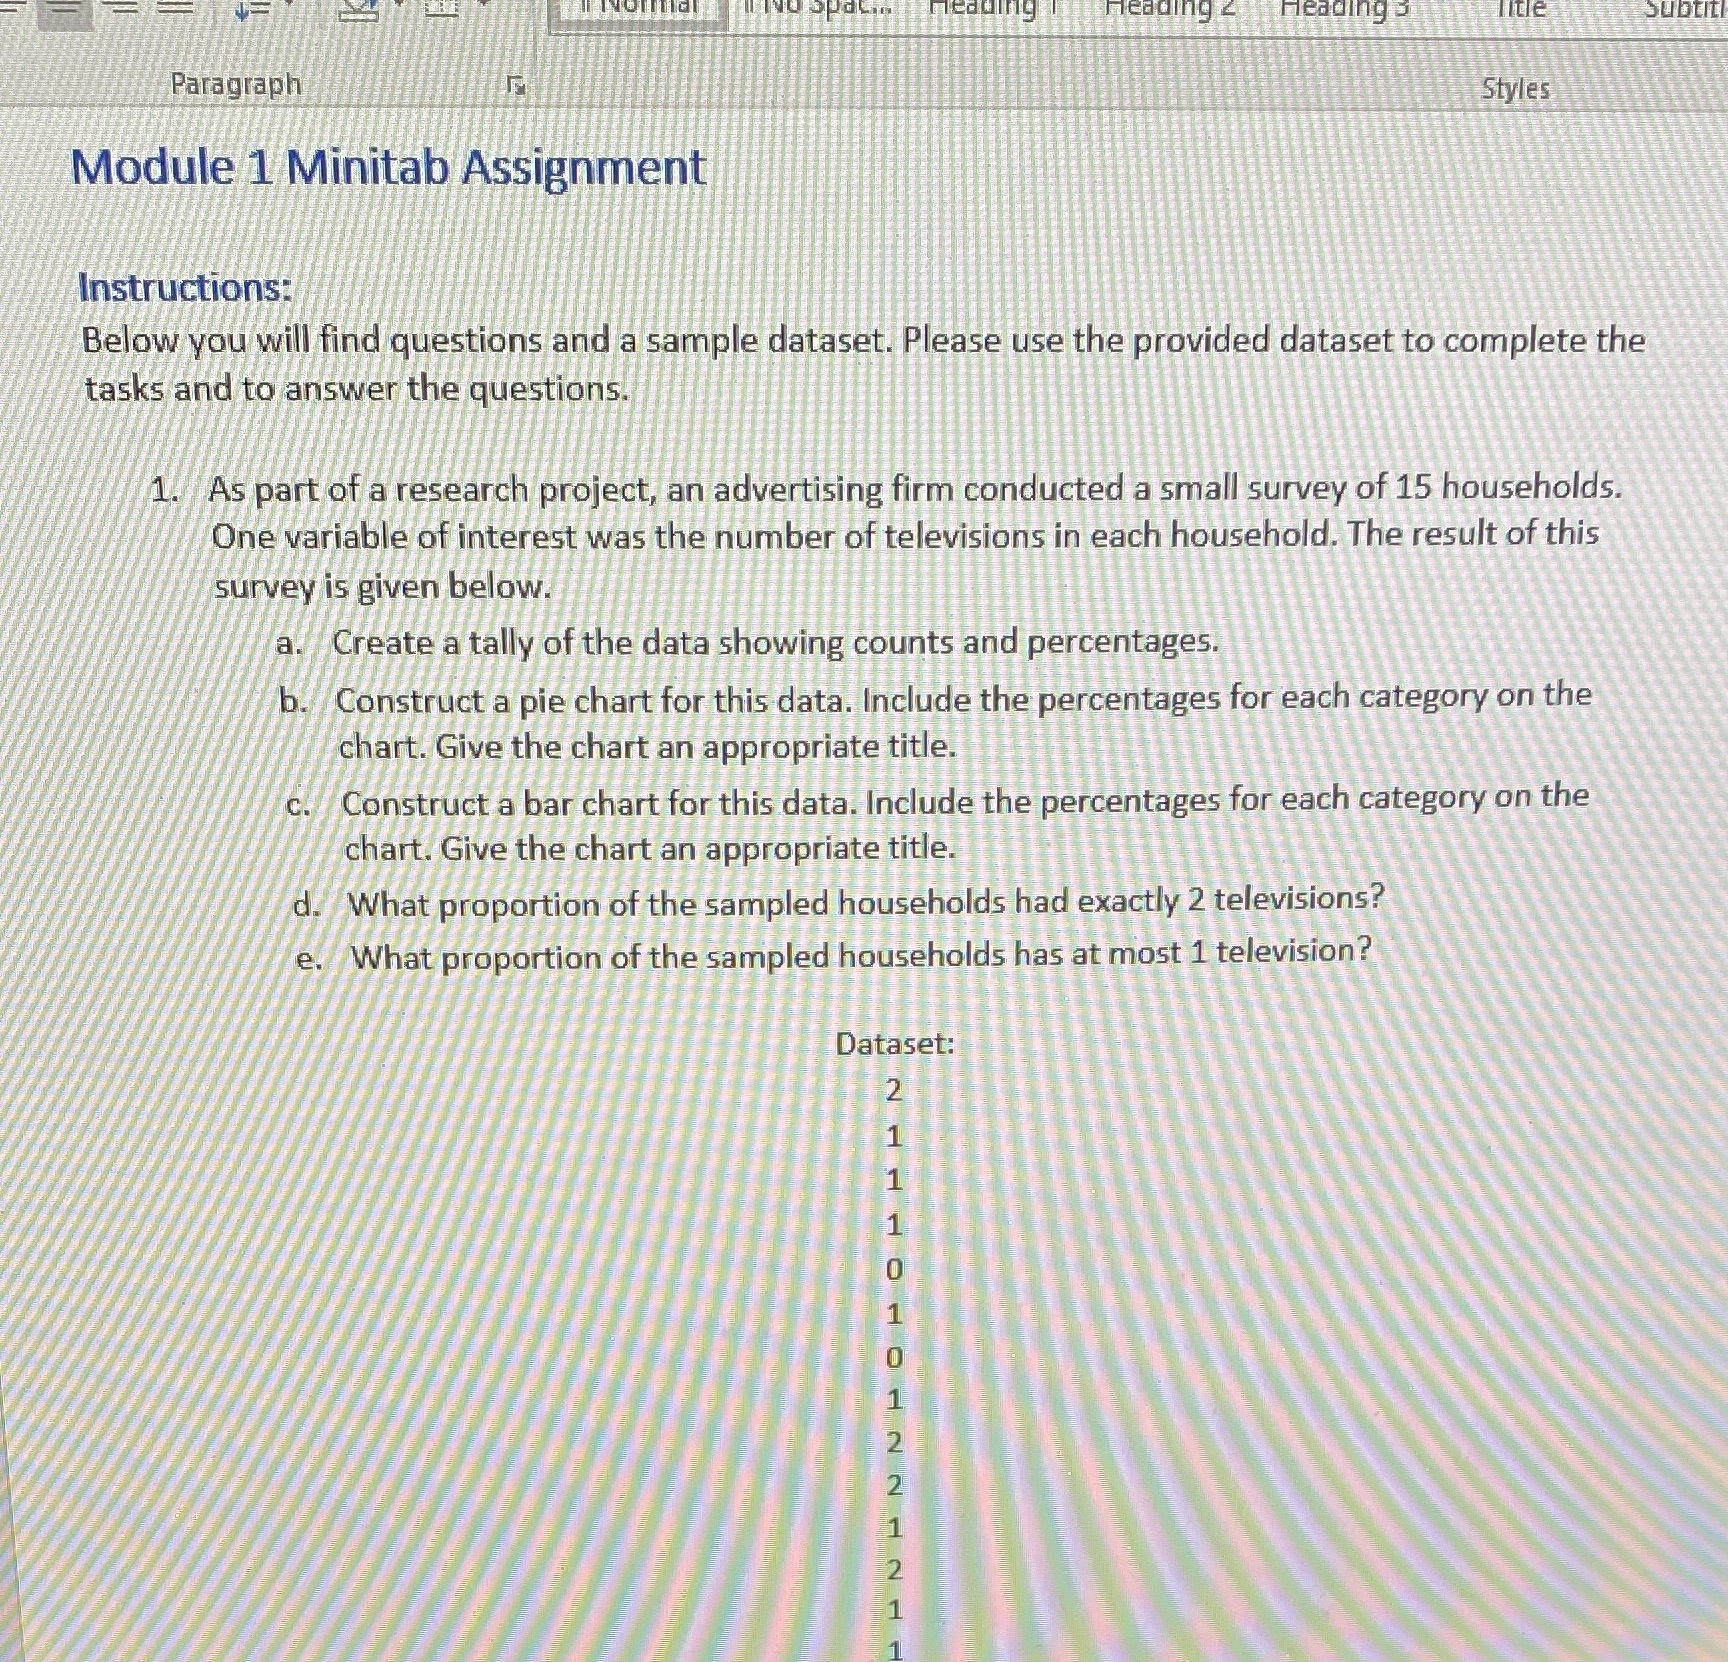
SUbtIt Paragraph Styles Module 1 Minitab Assignment Instructions: Below you will find questions and a sample dataset. Please use the provided dataset to complete the tasks and to answer the questions. 1. As part of a research project, an advertising firm conducted a small survey of 15 households. One variable of interest was the number of televisions in each household. The result of this survey is given below. a. Create a tally of the data showing counts and percentages. b. Construct a pie chart for this data. Include the percentages for each category on the chart. Give the chart an appropriate title. C. Construct a bar chart for this data. Include the percentages for each category on the chart. Give the chart an appropriate title. d. What proportion of the sampled households had exactly 2 televisions? e. What proportion of the sampled households has at most 1 television? Dataset: N
Step by Step Solution
There are 3 Steps involved in it

Get step-by-step solutions from verified subject matter experts