

Question: succeeding in business with microsoft excel chapter 3 level 2 case problem Chapter 3 OL Determining Effective Data Display with Charts Level 2 - Analyzing
succeeding in business with microsoft excel chapter 3 level 2 case problem 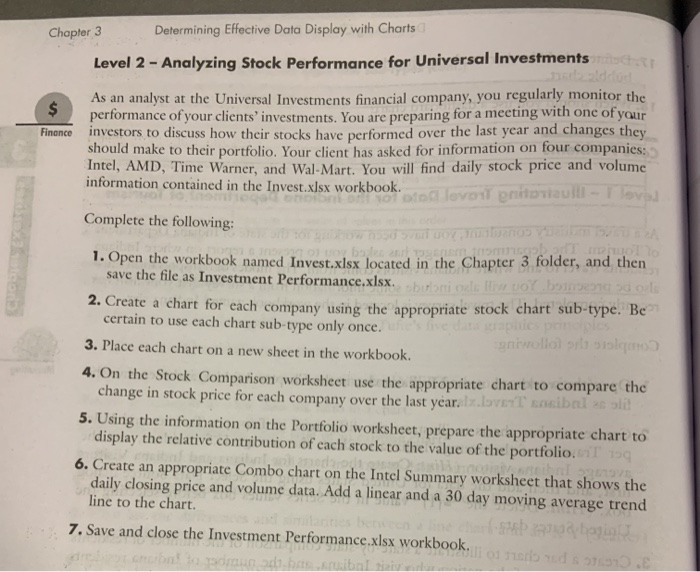
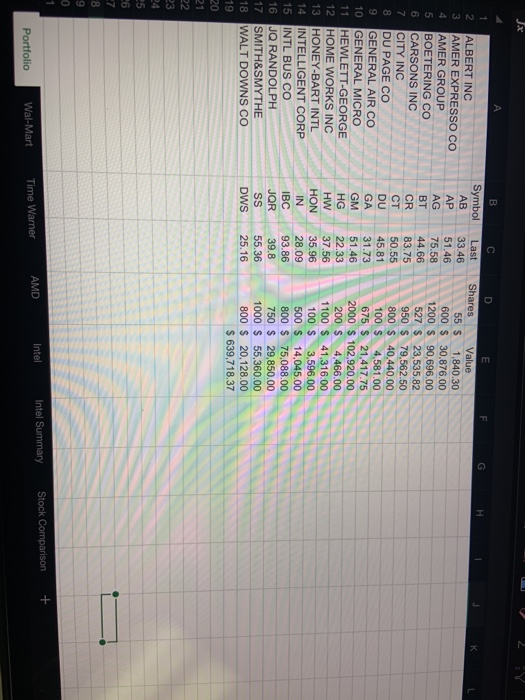
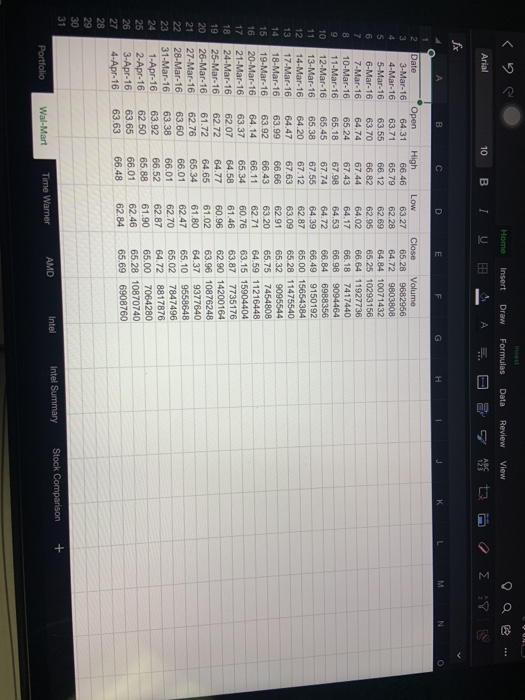
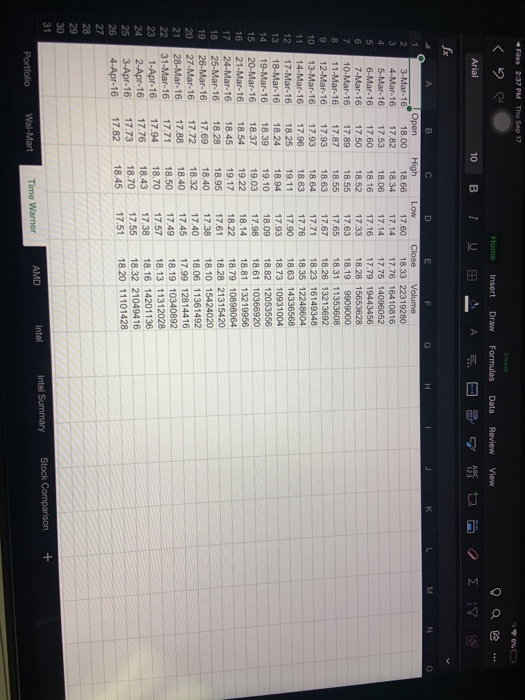
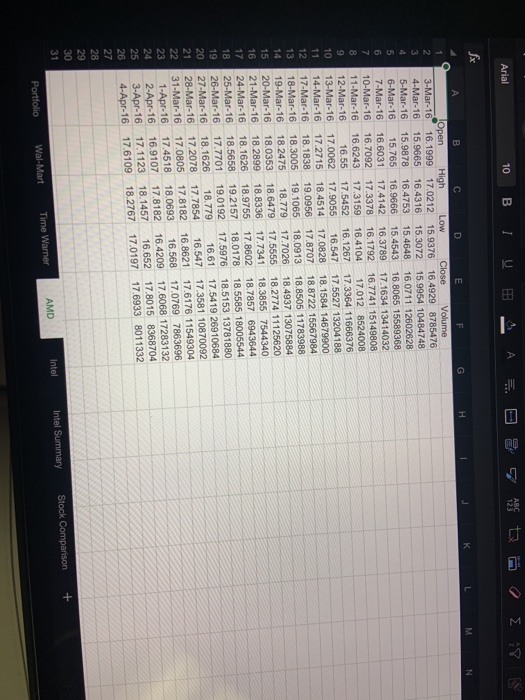
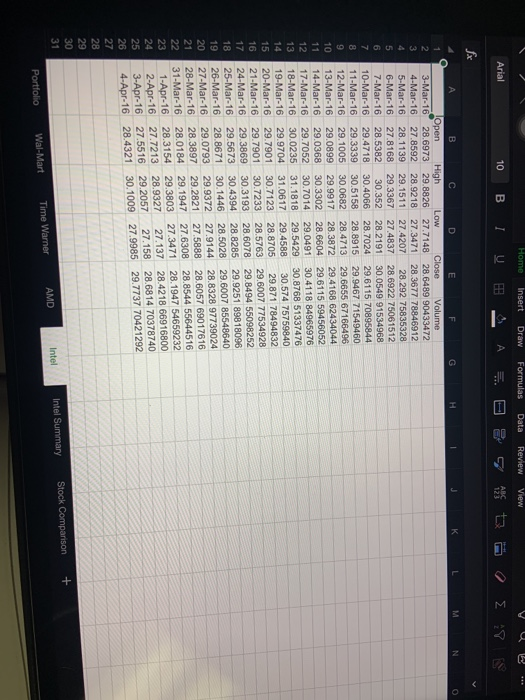
Chapter 3 OL Determining Effective Data Display with Charts Level 2 - Analyzing Stock Performance for Universal Investments $ As an analyst at the Universal Investments financial company, you regularly monitor the performance of your clients' investments. You are preparing for a meeting with one of your Financo investors to discuss how their stocks have performed over the last year and changes they should make to their portfolio. Your client has asked for information on four companies: Intel, AMD, Time Warner, and Wal-Mart. You will find daily stock price and volume information contained in the Invest.xlsx workbook. 'ind love entoriull - I love Complete the following: bater 1. Open the workbook named Invest.xlsx located in the Chapter 3 folder, and then save the file as Investment Performance.xlsx borot to be 2. Create a chart for each company using the appropriate stock chart sub-type. Be certain to use each chart sub-type only once. 3. Place each chart on a new sheet in the workbook. gniwoli silno 4. On the Stock Comparison worksheet use the appropriate chart to compare the change in stock price for each company over the last year.z.lvt saibal oli 5. Using the information on the Portfolio worksheet, prepare the appropriate chart to display the relative contribution of each stock to the value of the portfolio. 199 6. Create an appropriate Combo chart on the Intel Summary worksheet that shows the daily closing price and volume data. Add a linear and a 30 day moving average trend line to the chart 7. Save and close the Investment Performance.xlsx workbook. booklis arbads 910930 JX B G H Symbol AB AP AG BT CR 1 2 ALBERT INC 3 AMER EXPRESSO CO 4 AMER GROUP 5 BOETERING CO 6 CARSONS INC 7 CITY INC 8 DU PAGE CO 9 GENERAL AIR CO 10 GENERAL MICRO 11 HEWLETT-GEORGE 12 HOME WORKS INC 13 HONEY-BART INTL 14 INTELLIGENT CORP 15 INTL BUS CO 16 JQ RANDOLPH 17 SMITH&SMYTHE 18 WALT DOWNS CO 19 20 21 22 23 24 25 26 7 8 9 0 1. DU GA GM HG HW HON IN IBC JOR SS DWS C Last 33.46 51.46 75.58 44.66 83.75 50.55 45.81 31.73 51.46 22.33 37.56 35.96 28.09 93.86 39.8 55.36 25.16 D E Shares Value 55 s 1.840.30 600 $ 30,876.00 1200 S 90,696.00 527 $ 23,535.82 950 $ 79,562.50 800 $ 40.440.00 100 $ 4,581.00 675 $ 21,417.75 2000 $ 102,920.00 200 $ 4,466.00 1100 $ 41.316.00 100 $ 3,596.00 500 $ 14,045.00 800 $ 75,088.00 750 $ 29,850.00 1000 $ 55,360.00 800 $ 20,128.00 $ 639.718.37 + Intel Stock Comparison AMD Intel Summary Portfolio Wal-Mart Time Warner Invest Home Insert Draw Formulas Data Review View Arial 10 B I A DU ARC 23 ] D E H . N 3 4 5 6 7 8 9 10 11 12 13 14 15 16 17 18 19 20 21 22 23 24 25 26 27 28 29 30 31 Date Open 3-Mar-16 64.31 4-Mar-16 63.71 5-Mar-16 63.55 6-Mar-16 63.70 7-Mar-16 64.74 10-Mar-16 65.24 11-Mar-16 65.18 12-Mar-16 65.45 13-Mar-16 65.38 14-Mar-16 64.20 17-Mar-16 64.47 18-Mar-16 63.99 19-Mar-16 63.92 20-Mar-16 64.14 21-Mar-16 63.37 24-Mar-16 62.07 25-Mar-16 62.72 26-Mar-16 61.72 27-Mar-16 62.76 28-Mar-16 63.60 31-Mar-16 63.38 1-Apr-16 63.92 2-Apr-16 62.50 3-Apr-16 63.65 4-Apr-16 63.63 High 66.46 65.79 66.12 66.82 67.44 67.43 67.98 67.74 67.55 67.12 67.63 66.66 66.43 66.11 65.34 64.58 64.77 64.65 65.34 66.01 66.01 66.52 65.88 66.01 66.48 Low 63.27 62.28 62.69 62.95 64.02 64.17 64.53 64.72 64.39 62.87 63.09 62.91 63.20 62.71 60.76 1.46 60.96 61.02 61.80 62.47 62.70 62 87 61.90 62.46 62.84 Close Volume 65.28 9682956 64.72 9803808 64.84 10071432 65.25 10293156 66.64 11927736 66.18 7417440 66.98 9094464 66.84 6988356 66.49 9150192 65.00 15654384 65.28 11475540 65.32 9095544 65.75 7454808 64.59 11216448 63.15 15904404 63.87 7735176 62.90 14200164 63.96 10876248 64.37 9377640 65.10 9558648 65.02 7847496 64.72 8817876 65.00 7064280 65 28 10870740 65.69 6908760 + Intel Stock Comparison Intel Summary AMD Portfolio Wal-Mart Time Warner Files 2:37 PM Thu Sep 17 e Home Insert Draw Formulas Data Review View Arial 10 A ABC 123 ti E 9 S D E 0 fx B Open 3-Mar-16 18.00 3 4-Mar-16 1782 4 5-Mar-16 17.53 5 6-Mar-16 17.60 6 7-Mar-16 17.50 7 10-Mar-16 17.89 8 11-Mar-16 17.87 9 12-Mar-16 17.93 10 13-Mar-16 17.93 11 14-Mar-16 17.96 12 17-Mar-16 18.25 13 18-Mar-16 18.24 19-Mar-16 18.39 15 20-Mar-16 18.37 16 21-Mar-16 18.54 17 24-Mar-16 18.45 18 25-Mar-16 18.28 19 26-Mar-16 17.69 20 27-Mar-16 17.72 21 28-Mar-16 17.88 22 31-Mar-16 17.71 23 1-Apr-16 17.94 24 2-Apr-16 17.76 25 3-Apr-16 17.73 26 4-Apr-16 17.82 27 28 29 30 31 High 18.66 18.34 18.06 18.16 18.52 18.55 18.55 18.63 18.64 18.63 19.11 18.94 19.10 19.03 19.22 19.17 18.95 18.40 18.32 18.40 18.50 18.70 18.43 18.70 Low 17.60 17.14 17.14 17.16 17.33 17.63 17.65 17.67 17.71 17.76 17.90 17.93 18.00 17.98 18.14 18.22 17.61 17.38 17.40 17.45 17.49 17.57 17.38 17.55 17.51 Close Volume 18.33 22319280 17.76 16410116 17.75 14096052 17.79 19443456 18 28 15653628 18.19 9909000 18.31 11353608 18.26 13213692 18.23 16149348 18.35 12248604 18.63 14336568 18.73 10931004 18.82 12053556 18.61 10366920 18.81 13219956 18.79 10898064 18.28 21315420 18.10 15424020 18.06 11361492 17.99 12814416 18.19 10340892 18.13 11312028 18.16 14201136 18.32 21049416 18.20 11101428 18.45 Stock Comparison Intel AMD Intel Summary Portfolio Wal-Mart Time Warner 5 Ant BI UB Arial E 10 M N G Open 2 3 5 6 7 8 9 10 11 12 13 14 15 16 17 18 19 20 21 22 23 24 25 26 27 28 29 30 31 B C D E F High Low Close Volume 3-Mar-16 16.1999 17.0212 15.9376 16.4929 8785476 4-Mar-16 15.9665 16.4316 15.3072 15.9954 10484748 5-Mar-16 15.9878 16.4753 15.4648 16.0711 12602628 6-Mar-16 15.765 16.9666 15.4543 16.8065 15589368 7-Mar-16 16.6031 17.4142 16.3789 17.1634 13414032 10-Mar-16 16.7092 17.3378 16.1792 16.7741 15149808 11-Mar-16 16.6243 17.3159 16 4104 17.012 8524008 12-Mar-16 16.55 17.5452 16.1267 17.3364 11666376 13-Mar-16 17.0062 17.9055 16.547 17.5527 13204188 14-Mar-16 17 2715 18.4514 17.0828 18.1584 14679900 17-Mar-16 18.1838 19.0956 17.8707 18.8722 15567984 18-Mar-16 18.3005 19. 1065 18.0913 18.8505 11783988 19-Mar-16 18.2475 18.779 17.7026 18.4937 13075884 20-Mar-16 18.0353 18.6479 17.5555 18.2774 11125620 21-Mar-16 18.2899 18.8336 17.7341 18.3855 7544340 24-Mar-16 18.1626 18.9755 17.8602 18.7857 6943644 25-Mar-16 18.5658 19.2157 18.0178 18.5585 18005544 26-Mar-16 17.7701 19.0192 17.5976 18.5153 13781880 27-Mar-16 18.1626 18.779 16.61 17.5419 26910684 28-Mar-16 17.2078 17.7854 16.547 17.3581 10870092 31-Mar-16 17.0805 17.8182 16.8621 17.6176 11549304 1-Apr-16 17.4518 18.0693 16.568 17.07697863696 2-Apr-16 16.9107 17.8182 16.4209 17.6068 17283132 3-Apr-16 17.1123 18.1457 16.652 17.8015 8368704 4-Apr-16 17.6109 18.2767 17.0197 17.6933 8011332 + Stock Comparison Intel Summary Intel AMD Wal-Mart Portfolio Time Warner Home Insert Draw Formulas Data Review View Va Arial 10 BI U FB A E. & All t3 E9S 123 fx H Close 2 3 5 6 7 8 9 10 11 12 13 14 15 16 17 18 19 20 21 22 23 24 25 26 27 28 29 30 31 B C D E F lopen High Low Volume 3-Mar-16 28.6973 29.8826 27.7148 28.6489 90433472 4-Mar-16 27.8592 28.9218 27.3471 28.3677 78846912 5-Mar-16 28.1139 29.1511 27.4207 28 292 75835328 6-Mar-16 27.8168 29.3367 27.4837 28.6922 75061512 7-Mar-16 28.5382 30.352 28 2191 30.0549 91534968 10-Mar-16 29.4718 30.4066 28.7024 29.6115 70895844 11-Mar-16 29.3339 30.5158 28.8915 29.9467 71549460 12-Mar-16 29.1005 30.0682 28.4713 29.6655 67166496 13-Mar-16 29.0899 29.9917 28.3872 29.4168 62434044 14-Mar-16 29.0368 30.3302 28.6604 29.6115 59456052 17-Mar-16 29.7052 30.7014 29.0491 30.4118 84965976 18-Mar-16 30.0235 31.1818 29.5429 30.8768 51337476 19-Mar-16 29.9704 31.0617 29.4588 30.574 75759840 20-Mar-16 29.7901 30.7123 28.8705 29.871 78494832 21-Mar-16 29.7901 30.7233 28.5763 29.6007 77534928 24-Mar-16 29.3869 30.3193 28.6078 29.8494 55098252 25-Mar-16 29.5673 30.4394 28.8285 29.9251 89818096 26-Mar-16 28.8671 30.1446 28.5028 29.6007 85548640 27-Mar-16 29.0793 29.9372 27.9144 28.8328 97739024 28-Mar-16 28.3897 29.2821 27.5888 28.6057 69017616 31-Mar-16 28.0184 29.1947 27.6308 28.8544 55644516 1-Apr-16 28.3154 29.3803 27.3471 28.1947 54659232 2-Apr-16 27.7213 28.9327 27.137 28.4218 66916800 3-Apr-16 27.5516 29. 2057 27.158 28.6814 70378740 4-Apr-16 28.4321 30.1009 27.9985 29.7737 70421292 Stock Comparison Intel Summary Intel AMD Time Warner Wal-Mart Portfolio a Fes 2:38 PM Thu Sep 17 invest Formulas Review View Data Insert Home Draw
Step by Step Solution
There are 3 Steps involved in it
1 Expert Approved Answer
Step: 1 Unlock

Question Has Been Solved by an Expert!
Get step-by-step solutions from verified subject matter experts
Step: 2 Unlock
Step: 3 Unlock