

Question: SUCSTIOIT In the figure above, area B represents the decrease in consumer surplus to each buyer still in the market when the price increases from

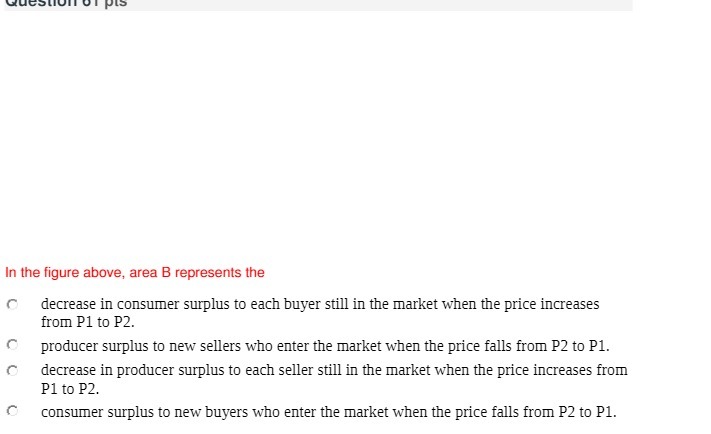
SUCSTIOIT In the figure above, area B represents the decrease in consumer surplus to each buyer still in the market when the price increases from P1 to P2. producer surplus to new sellers who enter the market when the price falls from P2 to P1. decrease in producer surplus to each seller still in the market when the price increases from P1 to P2. C consumer surplus to new buyers who enter the market when the price falls from P2 to P1
Step by Step Solution
There are 3 Steps involved in it
1 Expert Approved Answer
Step: 1 Unlock

Question Has Been Solved by an Expert!
Get step-by-step solutions from verified subject matter experts
Step: 2 Unlock
Step: 3 Unlock