

Question: Sully, Inc. (SLY) is considering upgrading system hardware in approximately 250 of its existing restaurants to accommodate greater traffic flow in several strategic areas of
Sully, Inc. (SLY) is considering upgrading system hardware in approximately 250 of its existing restaurants to accommodate greater traffic flow in several strategic areas of the Southeastern U.S. The upgrade will offer two primary advantages over their existing structures: (1) significantly greater revenue, and (2) stronger economies of scale in maintaining fixed and variable costs per store. Assume you were recently hired to participate on a team under SLYs CFO that is responsible for evaluating the cash flows and profitability associated with this specific project (starting in the summer of 2021).
Initially, your team concludes that such a full-scale expansion would require new equipment costs (within existing restaurants) of $281,000,000, plus an additional shipping and installation costs of $2,500,000 (to be included in the initial cost). In addition, to accommodate increased cash and inventory needs, net working capital requirements are expected to rise by $17,000,000 so the refurbished restaurants will be operationally functional. The equipment is to be depreciated using a 5-year Modified Accelerated Cost Recovery System (MACRS) schedule. Not knowing what the future holds, your team also concludes that this new project will exist for only 5 years thereby finishing in the summer of 2026.
Adjustments to the companys operating cash flows are expected to begin in July of 2021 when the stores are deemed fully operationally functional. Also, the new equipment is expected to have a market value of $32,000,000 at the projects termination.
Last, your team makes the following assumptions regarding marginal increases in sales and costs for SLY:
- 11,000,000 units will be sold in years 1 & 2, at an average sales price of $13.50 per unit, while 13,000,000 units will be sold in years 3, 4 & 5, at an average sales price of $14.50 per unit.
- Total operating costs (both fixed and variable) are anticipated to be 60% of sales in years 1 & 2, 55% of sales in years 3 & 4, and 50%of sales in year 5.
- MRs marginal tax rate is 32% (used in both deriving Operating Cash Flows as well as tax loss/gain in salvage value).
Last, you assume that SLY will raise all of the capital to finance this project only debt, using the following assumptions: The firm currently has finds similar term/quality bonds outstanding; Remaining Maturity = 6 years, Coupon Rate = 5.34% (semiannual pay), Current Price = $980.
In order to evaluate this project, answer the following questions in deriving a cash flow analysis and recommendation.
- What is the initial cash outlay (CF0)?
- What are the operating cash flows in years 1 thru 5 - adjusted for taxes and depreciation?
- What are the terminal-year cash flows added to the operating cash flow in year 5?
- What is the Cost of Capital, assuming SLY finances its growth with debt only?
- Given your results for CF0 thru C05 and the cost of capital, would you recommend that the company take-on this project? Compute and explain the significance of the NPV & IRR to support your answer.
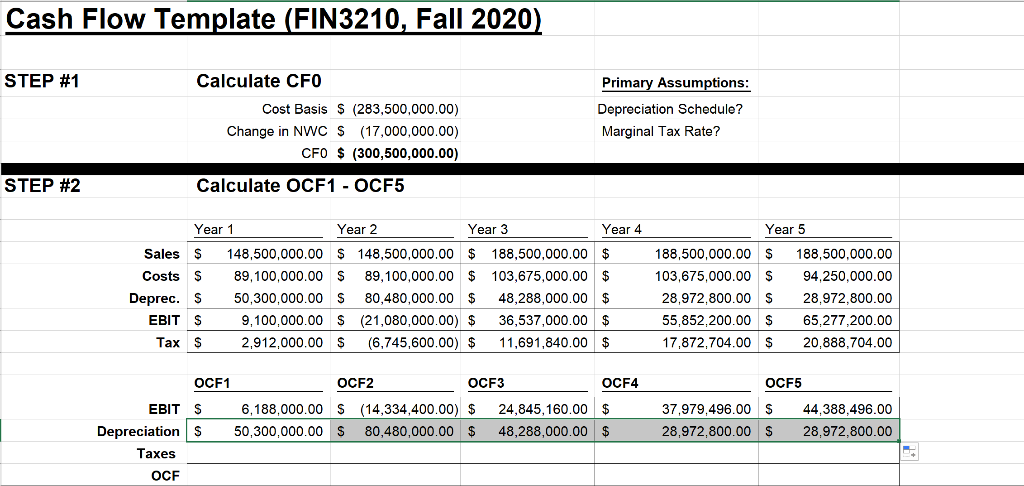
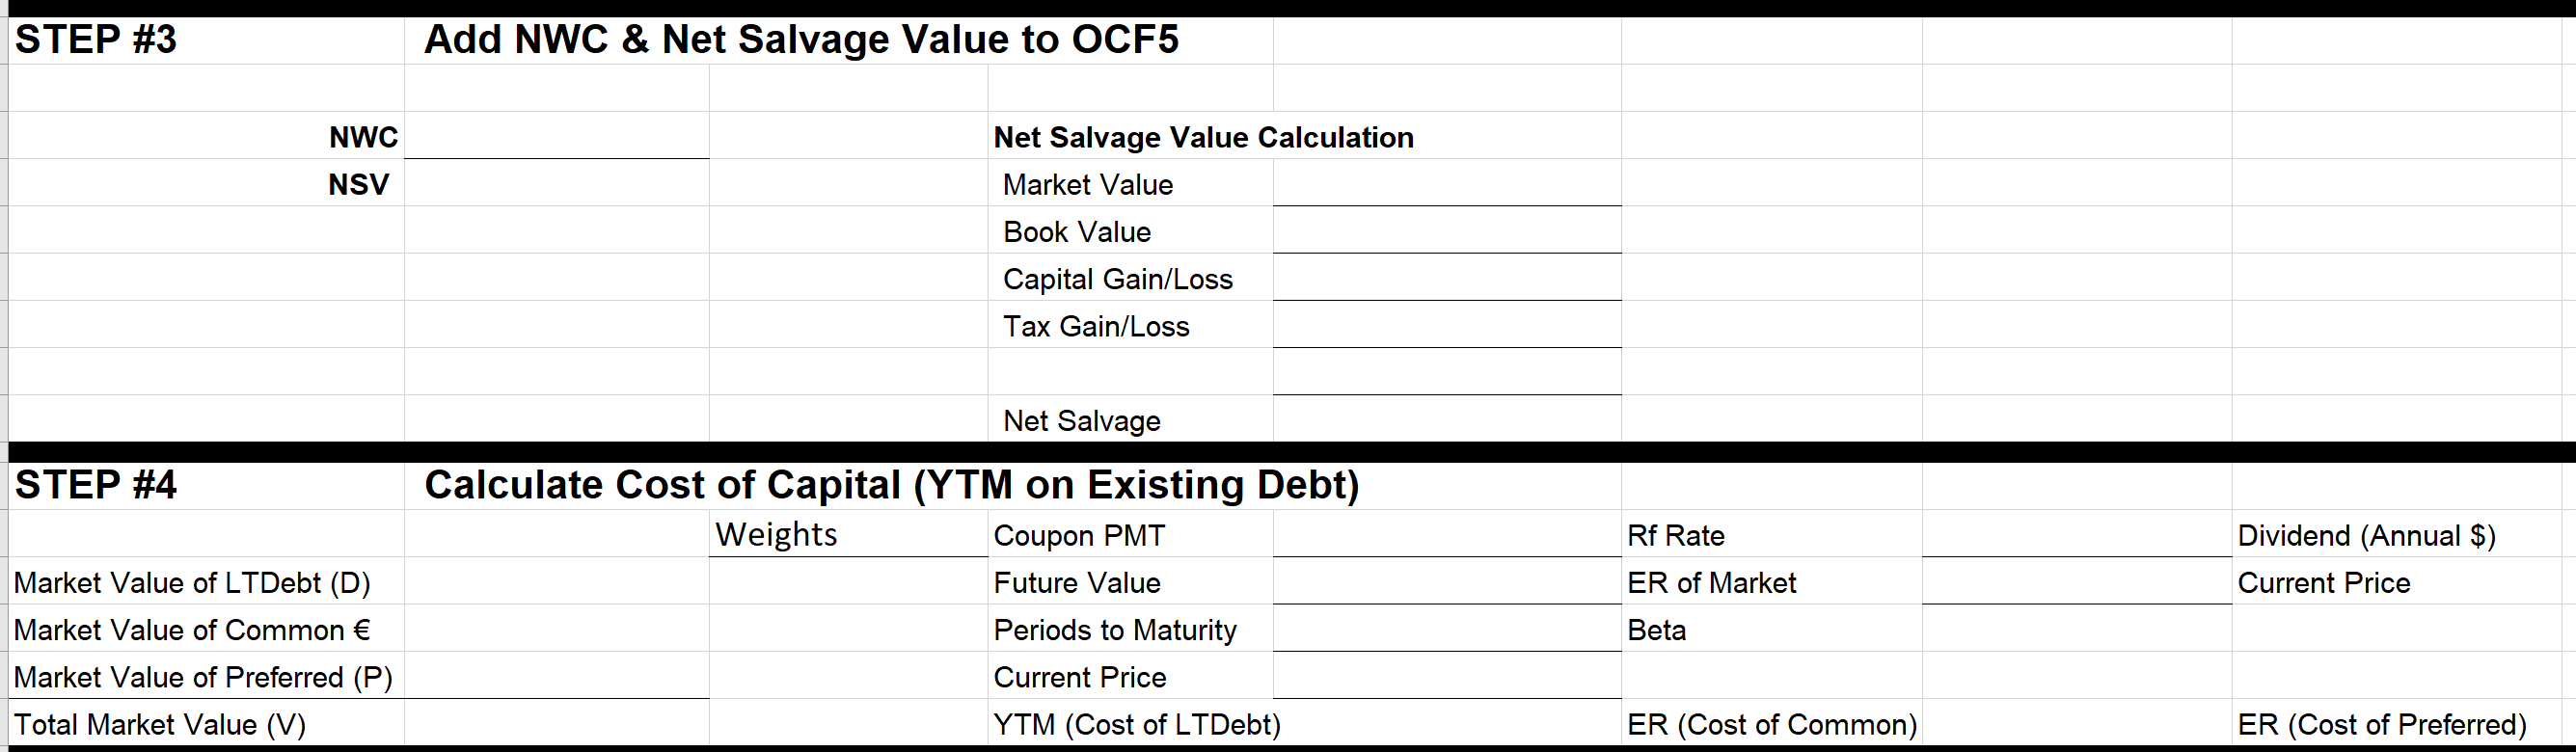
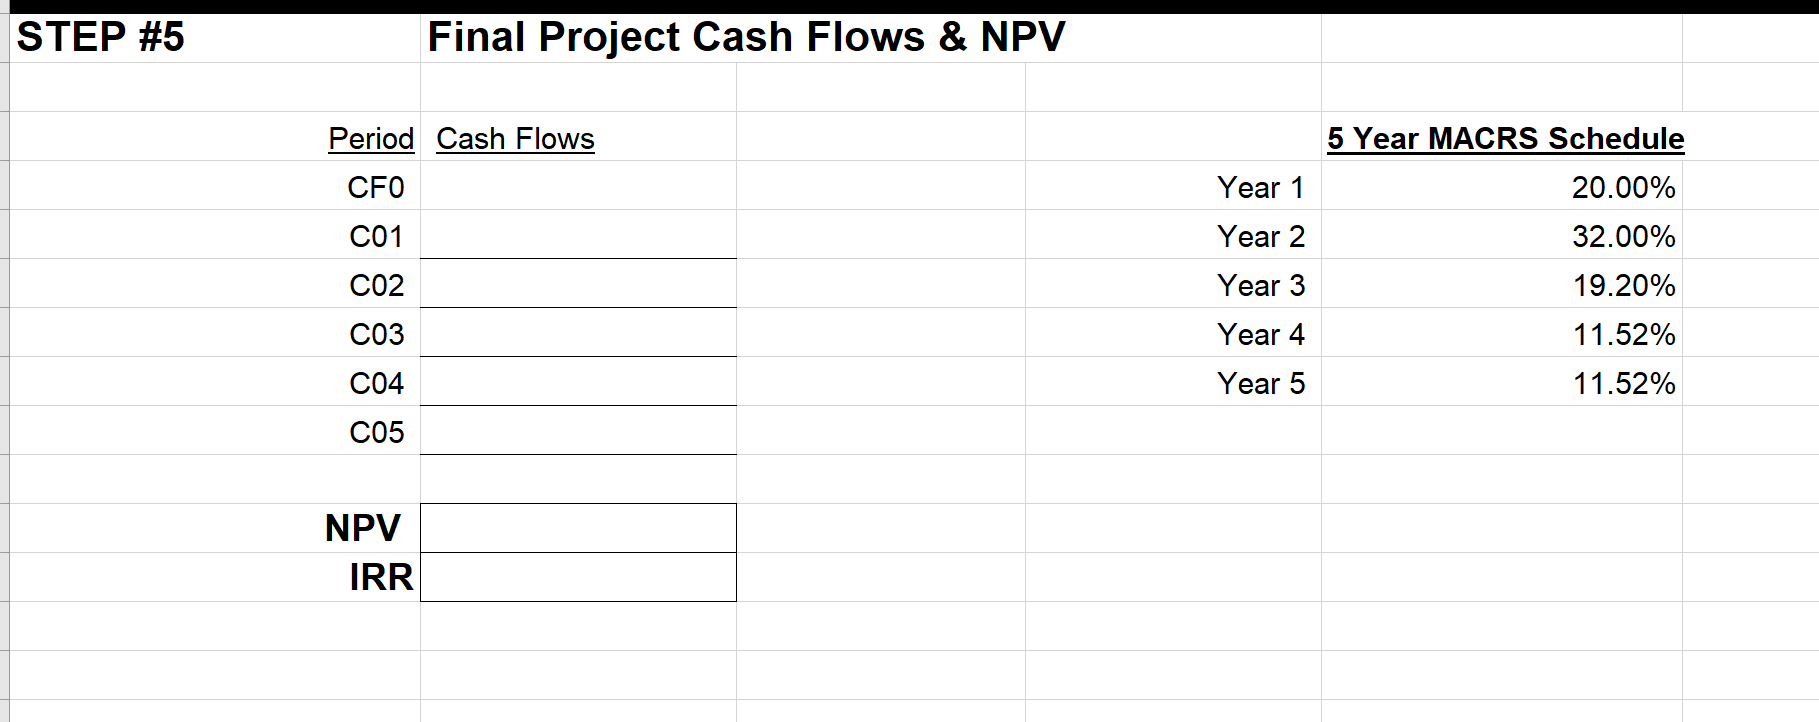
Cash Flow Template (FIN3210, Fall 2020) STEP #1 Calculate CFO Cost Basis $ (283,500,000.00) Change in NWC S (17,000,000.00) CFO $ (300,500,000.00) Primary Assumptions: Depreciation Schedule? Marginal Tax Rate? STEP #2 Calculate OCF1 - OCF5 Year 5 Year 1 Year 2 Year 3 Year 4 Sales $ 148,500,000.00 $ 148,500,000.00 $ 188,500,000.00 $ Costs S 89,100,000.00 S 89,100,000.00 $ 103,675,000.00 $ Deprec. S 50,300,000.00 S 80,480,000.00 $ 48,288,000.00 $ EBIT S 9,100,000.00 $ (21,080,000.00) $ 36,537,000.00 $ Tax S 2.912,000.00 S (6,745,600.00) $ 11,691,840.00 $ 188,500,000.00 $ 103,675,000.00 $ 28,972,800.00 S 55,852,200.00 $ 17,872,704.00 S 188,500,000.00 94,250,000.00 28,972,800.00 65,277,200.00 20,888,704.00 OCF1 OCF2 OCF3 OCF4 OCF5 6,188,000.00 S (14,334,400.00) $ 50,300,000.00 S 80,480,000.00 $ 24,845,160.00 $ 48,288,000.00 $ 37,979,496.00 S 28,972,800.00 $ 44,388,496.00 28,972,800.00 EBITS Depreciations Taxes OCF STEP #3 Add NWC & Net Salvage Value to OCF5 NWC NSV Net Salvage Value Calculation Market Value Book Value Capital Gain/Loss Tax Gain/Loss Net Salvage STEP #4 Rf Rate Dividend (Annual $) Current Price ER of Market Calculate Cost of Capital (YTM on Existing Debt) Weights Coupon PMT Future Value Periods to Maturity Current Price YTM (Cost of LTDebt) Market Value of LTDebt (D) Market Value of Common Market Value of Preferred (P) Total Market Value (V) Beta ER (Cost of Common) ER (Cost of Preferred) STEP #5 Final Project Cash Flows & NPV Period Cash Flows 5 Year MACRS Schedule CFO 20.00% C01 Year 1 Year 2 Year 3 32.00% CO2 19.20% 11.52% CO3 Year 4 C04 Year 5 11.52% C05 NPV IRR Cash Flow Template (FIN3210, Fall 2020) STEP #1 Calculate CFO Cost Basis $ (283,500,000.00) Change in NWC S (17,000,000.00) CFO $ (300,500,000.00) Primary Assumptions: Depreciation Schedule? Marginal Tax Rate? STEP #2 Calculate OCF1 - OCF5 Year 5 Year 1 Year 2 Year 3 Year 4 Sales $ 148,500,000.00 $ 148,500,000.00 $ 188,500,000.00 $ Costs S 89,100,000.00 S 89,100,000.00 $ 103,675,000.00 $ Deprec. S 50,300,000.00 S 80,480,000.00 $ 48,288,000.00 $ EBIT S 9,100,000.00 $ (21,080,000.00) $ 36,537,000.00 $ Tax S 2.912,000.00 S (6,745,600.00) $ 11,691,840.00 $ 188,500,000.00 $ 103,675,000.00 $ 28,972,800.00 S 55,852,200.00 $ 17,872,704.00 S 188,500,000.00 94,250,000.00 28,972,800.00 65,277,200.00 20,888,704.00 OCF1 OCF2 OCF3 OCF4 OCF5 6,188,000.00 S (14,334,400.00) $ 50,300,000.00 S 80,480,000.00 $ 24,845,160.00 $ 48,288,000.00 $ 37,979,496.00 S 28,972,800.00 $ 44,388,496.00 28,972,800.00 EBITS Depreciations Taxes OCF STEP #3 Add NWC & Net Salvage Value to OCF5 NWC NSV Net Salvage Value Calculation Market Value Book Value Capital Gain/Loss Tax Gain/Loss Net Salvage STEP #4 Rf Rate Dividend (Annual $) Current Price ER of Market Calculate Cost of Capital (YTM on Existing Debt) Weights Coupon PMT Future Value Periods to Maturity Current Price YTM (Cost of LTDebt) Market Value of LTDebt (D) Market Value of Common Market Value of Preferred (P) Total Market Value (V) Beta ER (Cost of Common) ER (Cost of Preferred) STEP #5 Final Project Cash Flows & NPV Period Cash Flows 5 Year MACRS Schedule CFO 20.00% C01 Year 1 Year 2 Year 3 32.00% CO2 19.20% 11.52% CO3 Year 4 C04 Year 5 11.52% C05 NPV IRR
Step by Step Solution
There are 3 Steps involved in it

Get step-by-step solutions from verified subject matter experts