

Question: summarized data follow a . Select the graph that correctly shows the yield curve associated with the data shown in the table. b . Describe
summarized data follow
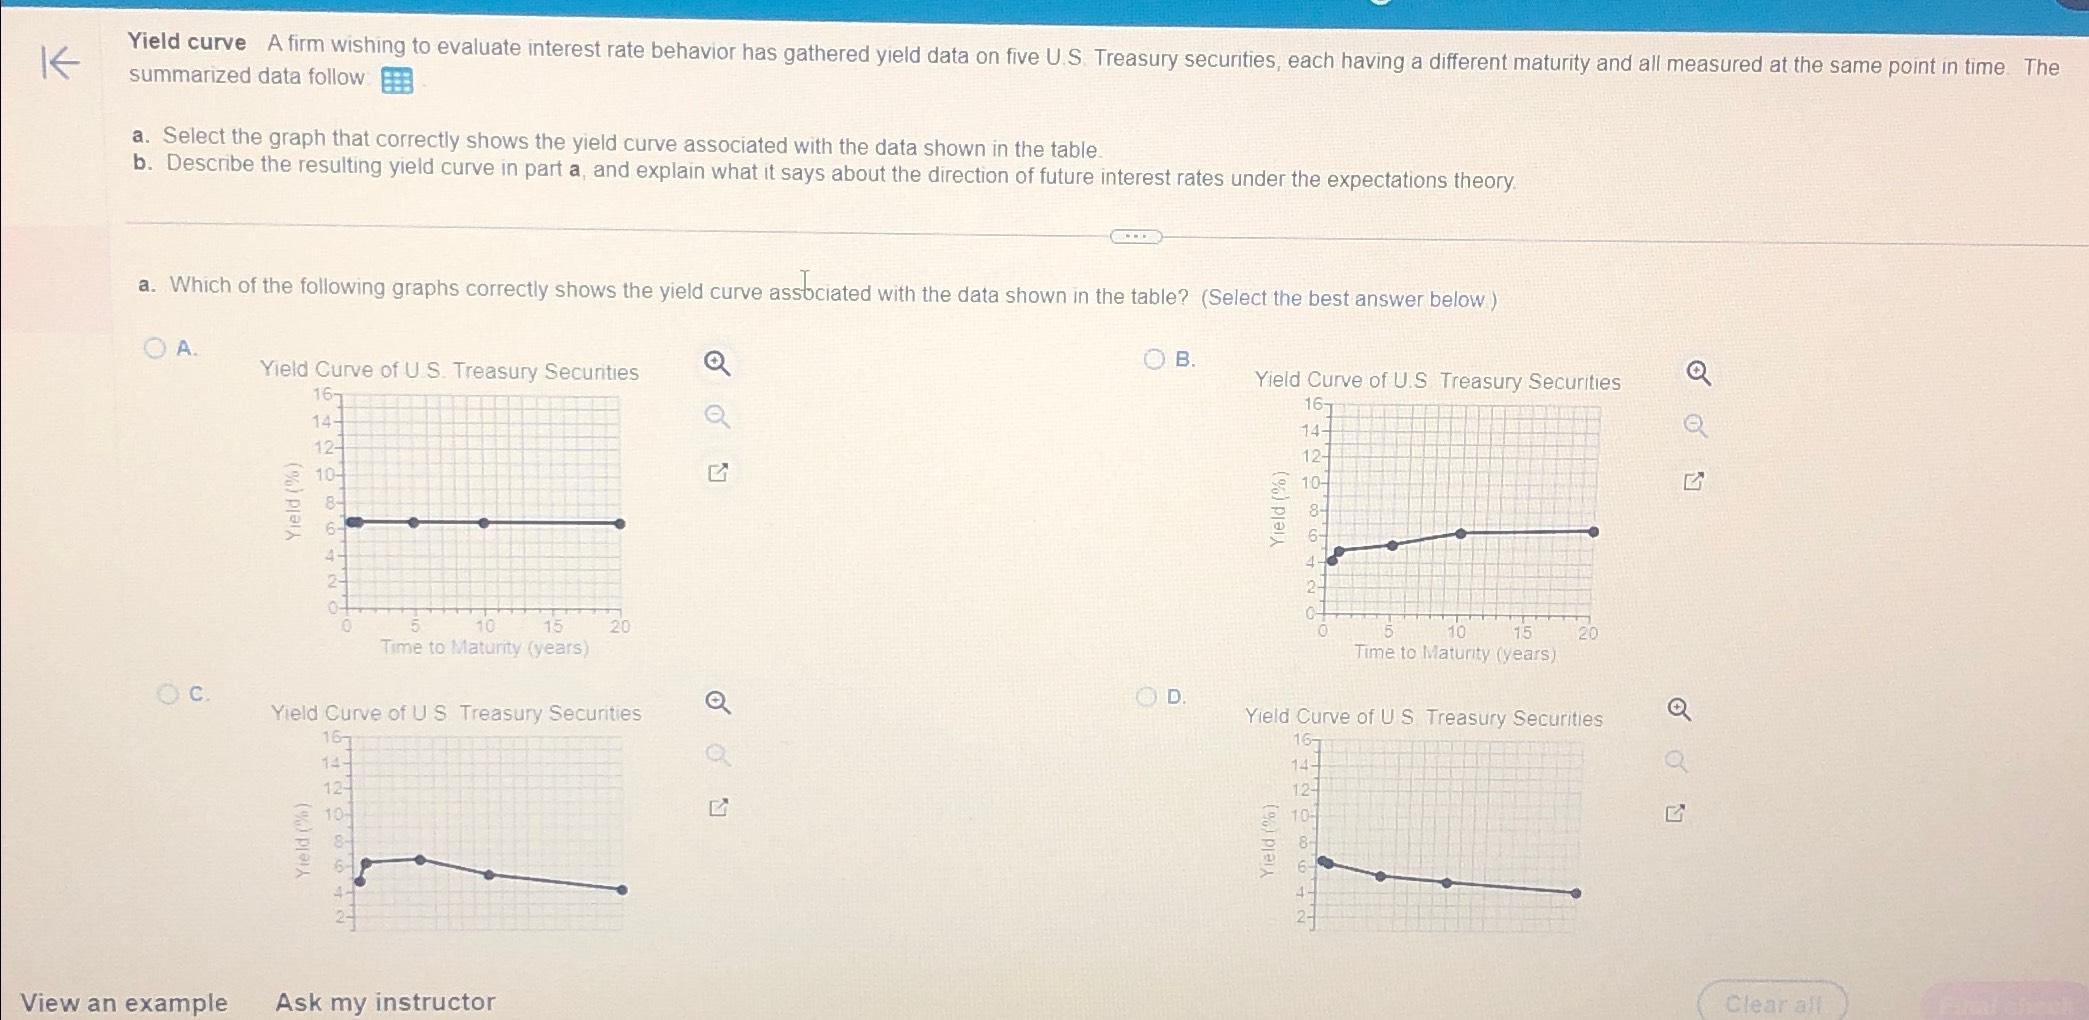
a Select the graph that correctly shows the yield curve associated with the data shown in the table.
b Describe the resulting yield curve in part and explain what it says about the direction of future interest rates under the expectations theory.
a Which of the following graphs correctly shows the yield curve assfociated with the data shown in the table? Select the best answer below
A Yiald Curva nf II S Tragcuni Sonuritioe
c Yield Curve of IIS Treasurv Sarunities Q
View an example
Ask my instructor
B
Vipld Curva nflle Trasciuns Saruiritine
D Yield Curve of US Treasury Securities
Q
Q
Step by Step Solution
There are 3 Steps involved in it
1 Expert Approved Answer
Step: 1 Unlock

Question Has Been Solved by an Expert!
Get step-by-step solutions from verified subject matter experts
Step: 2 Unlock
Step: 3 Unlock