

Question: Summarizing Quantitative Data Test Show your work What can you conclude from the data in the line plots? The interquartile range for the junior varsity
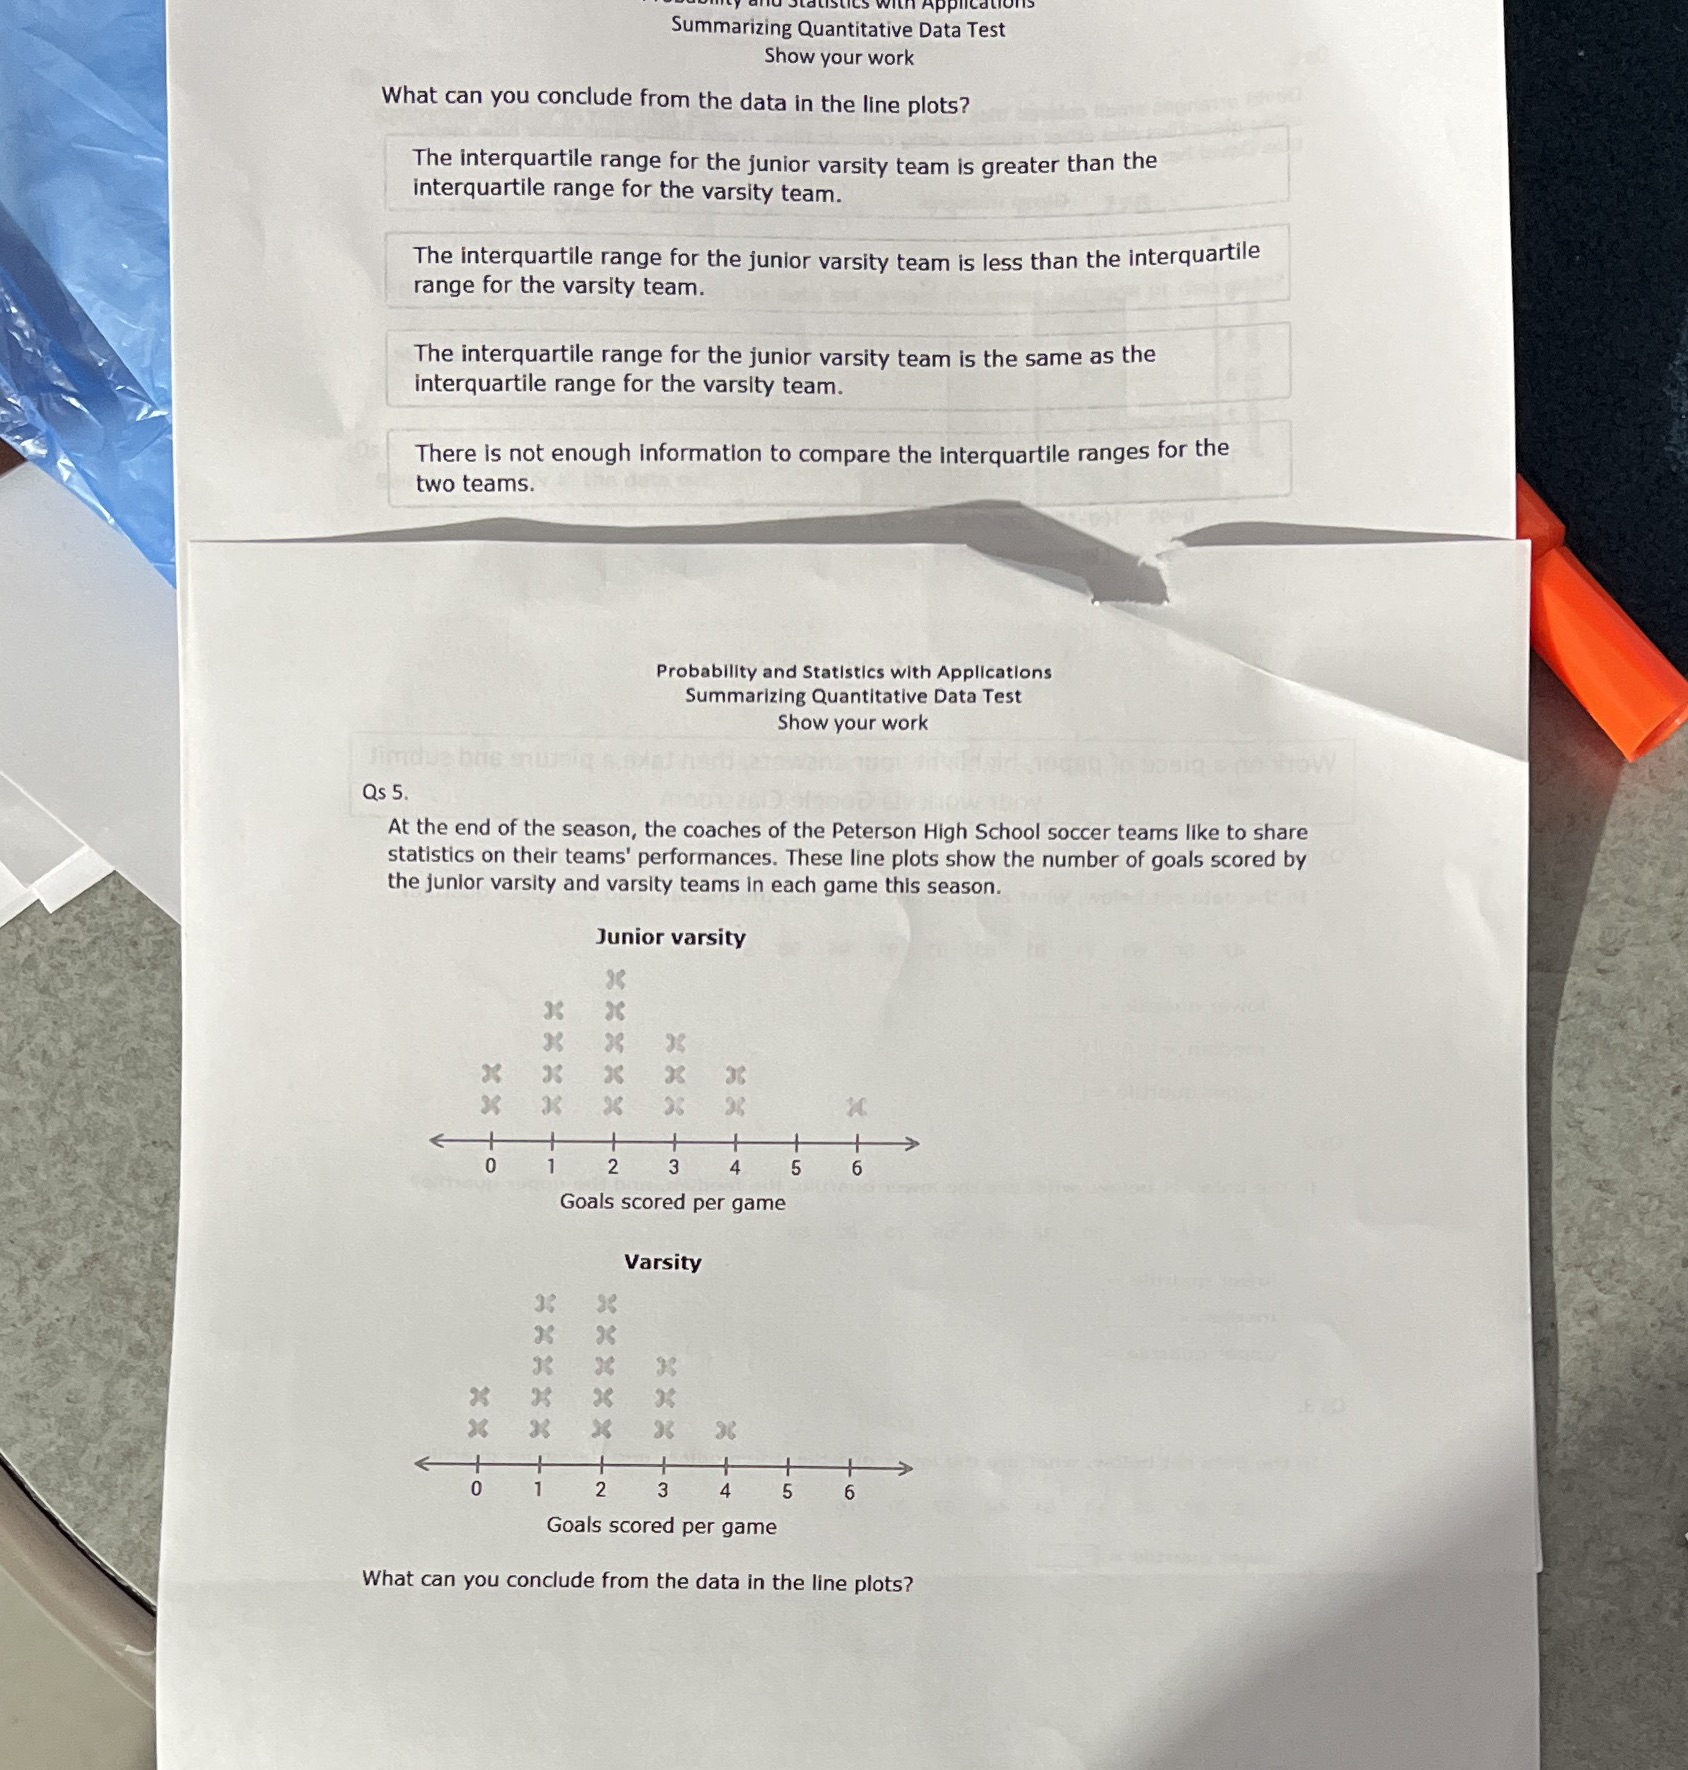
Summarizing Quantitative Data Test Show your work What can you conclude from the data in the line plots? The interquartile range for the junior varsity team is greater than the interquartile range for the varsity team. The interquartile range for the junior varsity team is less than the interquartile range for the varsity team. The interquartile range for the junior varsity team is the same as the interquartile range for the varsity team. There is not enough information to compare the interquartile ranges for the two teams. Probability and Statistics with Applications Summarizing Quantitative Data Test Show your work Qs 5. At the end of the season, the coaches of the Peterson High School soccer teams like to share statistics on their teams' performances. These line plots show the number of goals scored by the junior varsity and varsity teams In each game this season. Junior varsity X X X X 36 w + + N - Goals scored per game Varsity 28 ofxx 3 Goals scored per game What can you conclude from the data in the line plots
Step by Step Solution
There are 3 Steps involved in it

Get step-by-step solutions from verified subject matter experts