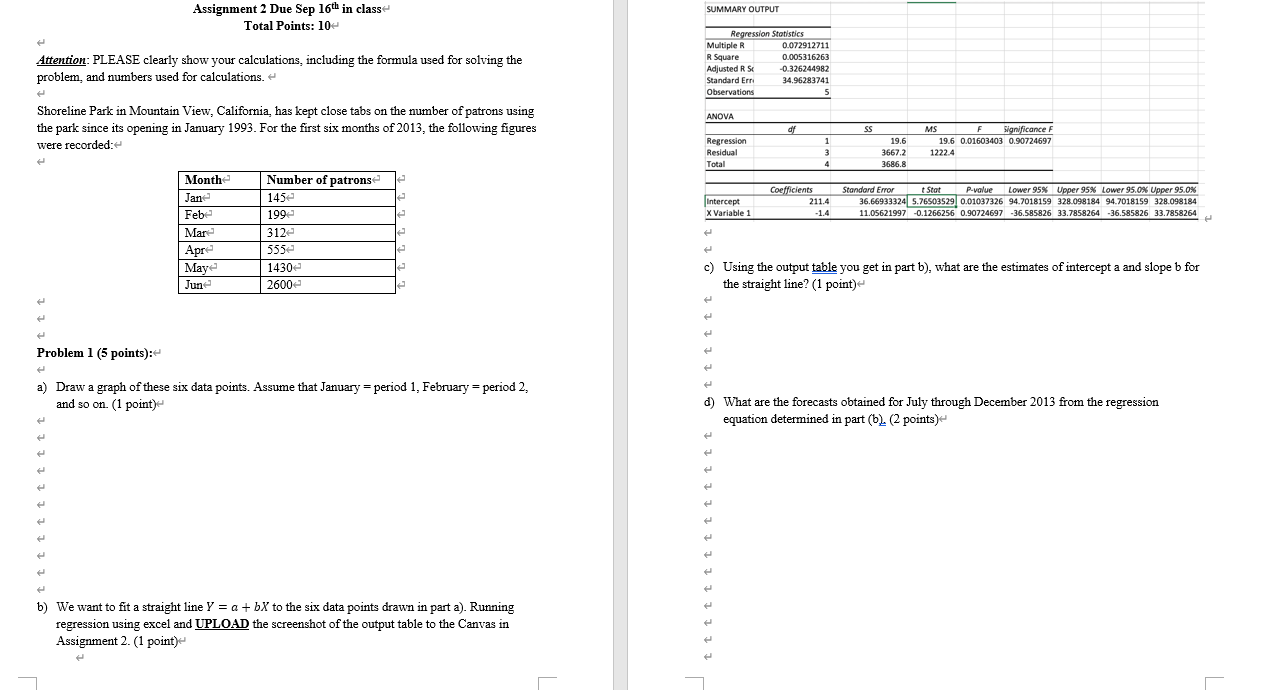
Question: SUMMARY OUTPUT Assignment 2 Due Sep 16th in classe Total Points: 10 Attention: PLEASE clearly show your calculations, including the formula used for solving the

SUMMARY OUTPUT Assignment 2 Due Sep 16th inSUMMARY OUTPUT Assignment 2 Due Sep 16th in

SUMMARY OUTPUT Assignment 2 Due Sep 16th in classe Total Points: 10 Attention: PLEASE clearly show your calculations, including the formula used for solving the problem, and numbers used for calculations. Regression Statistics Multiple R 0.072912711 R Square 0.005316263 Adjusted R S -0.326244982 Standard Erri 34.96283741 Observations 5 t ANOVA Shoreline Park in Mountain View, California, has kept close tabs on the number of patrons using the park since its opening in January 1993. For the first six months of 2013, the following figures were recorded: df SS Regression Residual Total 1 3 4 19.6 3667.2 3686.8 MS F Significance F 19.6 0.01603403 0.90724697 1222.4 1 Intercept X Variable 1 Coefficients 211.4 -1.4 Standard Error Stot P-value Lower 95% Upper 95% Lower 95.0% Upper 95.0% 36.66933324 5.76503529 0.01037326 94.7018159 328.098184 94.7018159 328.098184 11.05621997 -0.1266256 0.90724697 -36.585826 33.7858264 -36.585826 33.7858264 Month Jane Feb Mare Apre Maye June Number of patrons 145 199 312 555e 1430 26002 t t c) Using the output table you get in part b), what are the estimates of intercept a and slope b for the straight line? (1 point) Problem 1 (5 points): e a) Draw a graph of these six data points. Assume that January = period 1, February = period 2, and so on. (1 point) d) What are the forecasts obtained for July through December 2013 from the regression equation determined in part (6) (2 points) b) We want to fit a straight line Y = a + bx to the six data points drawn in part a). Running regression using excel and UPLOAD the screenshot of the output table to the Canvas in Assignment 2. (1 point) DUOKI Excel Search File Home Insert Page Layout Formulas Data Review View Developer Help Le From Text/CSV L From Web Get Data From Table/Range Recent Sources L Existing Connections El ML 7 F clear Te Reapply Queries & Connections B Properties Refresh All Edit Links Queries & Connections Stocks (En... Currencies... 9 ALL Sort Filter Advanced Sort & Filter Text to Columns CD Get & Transform Data Data Types Data Tools 19 D E F G H ] . B 1 SUMMARY OUTPUT 2 3 Regression Statistics 4. Multiple R 0.89441895 5 R Square 0.799985257 6 Adjusted R Square 0.749981572 7 Standard Error 0.935448822 8 Observations 6 9 10 ANOVA 11 df SS 12 Regression 13.999742 13 Residual 4 3.500257997 14 Total 5 17.5 15 16 Coefficients Standard Error 17 Intercept 1.991299162 0.536766551 18 X Variable 1 0.00172719 0.000431817 19 20 MS 13.999742 0.875064499 F 15.99852584 Significance F. 0.016132562 t Stat P-value Lower 95% Upper 95% Lower 95.0% Upper 95.0% 3.709804865 0.020657557 0.500996299 3.481602025 0.500996299 3.481602025 3.999815726 0.016132562 0.000528273 0.002926108 0.000528273 0.002926108

Step by Step Solution

There are 3 Steps involved in it

1 Expert Approved Answer
Step: 1 Unlock blur-text-image
Question Has Been Solved by an Expert!

Get step-by-step solutions from verified subject matter experts

Step: 2 Unlock
Step: 3 Unlock

Students Have Also Explored These Related General Management Questions!