

Question: SUMMARY OUTPUT Regression Statistics Multiple R 0.30799824 R Square 0.094862916 Adjusted R Square 0.071043519 Standard Error 0.054177825 Observations 40 Intercept S&P 500 Coefficients Standard Enor
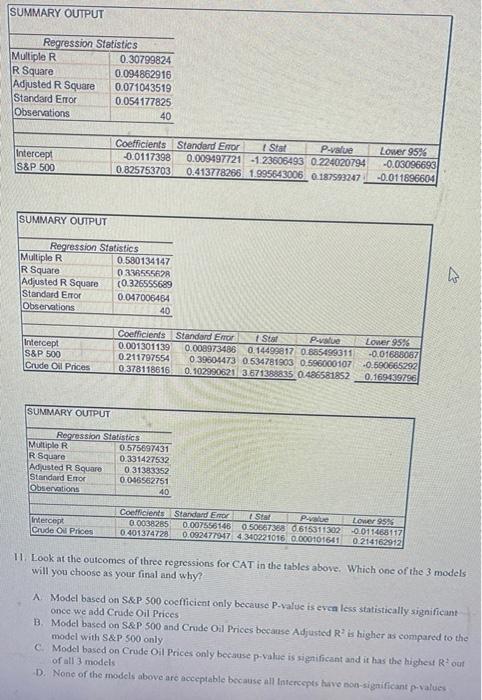
SUMMARY OUTPUT Regression Statistics Multiple R 0.30799824 R Square 0.094862916 Adjusted R Square 0.071043519 Standard Error 0.054177825 Observations 40 Intercept S&P 500 Coefficients Standard Enor I Stat P-value -0.0117398 0.009497721 -123606493 0.224020794 0.825753703 0.413778286 1.995643006 0.187593247 Lower 95% -0.03096693 -0.011896604 SUMMARY OUTPUT Regression Statistics Multiple R 0.580134147 R Square 03365552 Adjusted R Square (0.326555689 Standard Error 0.047006454 Observations 40 Intercept S&P 500 Crude Oil Prices Coefficients Standard Error Stat P-value 0.001301139 0.008973486 0.14499817 0.885459311 0211797554 0 39604473 0.534781903 0.596000107 0 378118616 0.102990621 3.671388835 0.486581852 Lower 956 -0.01688087 -0.580665292 0.169439796 SUMMARY OUTPUT Regression Statistics Multiple R 0.575697431 R Square 0.331427532 Adjusted R Square 0.31383352 Standard Enor 0046562751 Observations 40 Intercept Crude Oil Prices Coefficients Standard Emor Star PeLower 95% 0.0038285 0.007556146 0.50667388 0.615311302 -0.011463117 0.401374728 0.092477947 4340221016 0.000101641 0214162912 11. Look at the outcomes of three regressions for CAT in the tables above. Which one of the 3 models will you choose as your final and why? A Model based on S&P 500 coefficient only because P-value is even less statistically significant once we add Crude Oil Prices 1. Model based on S&P 500 and Crude Oil Prices because Adjusted R is higher as compared to the model with S&P 500 only C. Model based on Crude Oil Prices only because p-value is significant and it has the highest Rout of all 3 models D. None of the models above are acceptable because all intercepts have non significant p-values
Step by Step Solution
There are 3 Steps involved in it

Get step-by-step solutions from verified subject matter experts