

Question: SUMMARY OUTPUT Regression Statistics Multiple R 0.834298 R Square 0.696053 Adjusted R Square 0.645395 Standard Error 3.924283 Observations 8 ANOVA df SS MS F Significance

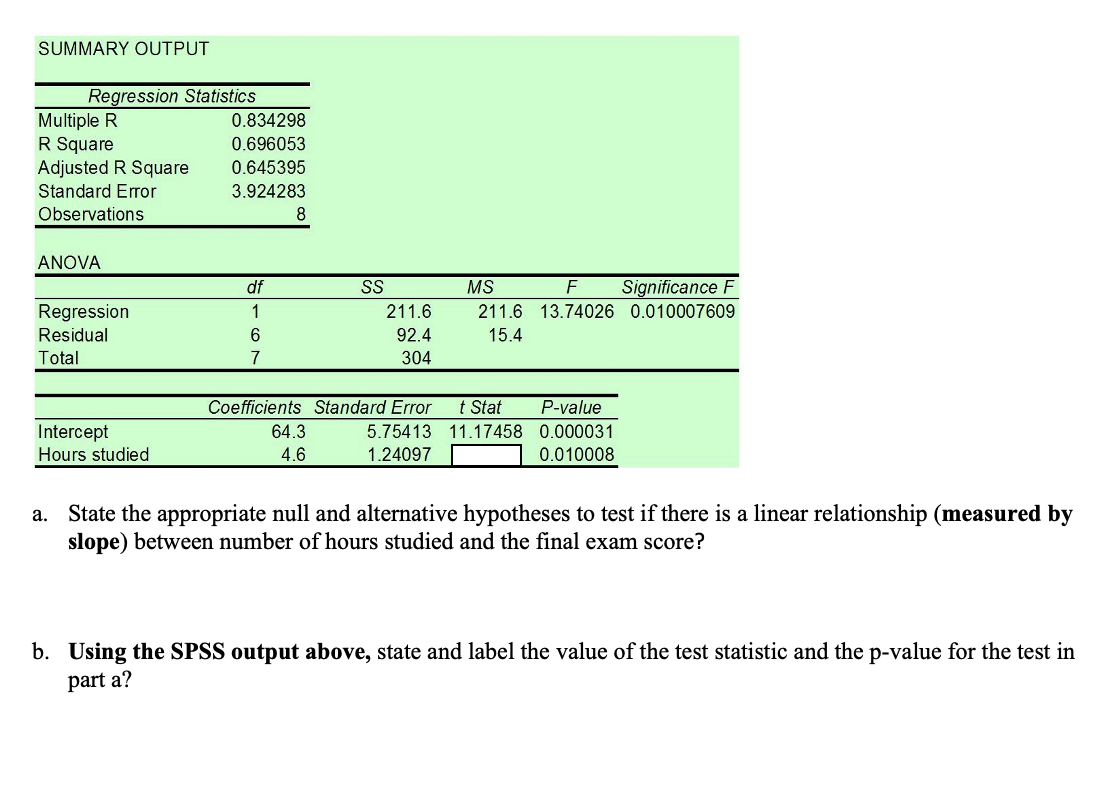
SUMMARY OUTPUT Regression Statistics Multiple R 0.834298 R Square 0.696053 Adjusted R Square 0.645395 Standard Error 3.924283 Observations 8 ANOVA df SS MS F Significance F Regression 211.6 211.6 13.74026 0.010007609 Residual 92.4 15.4 Total 304 Coefficients Standard Error t Stat P-value Intercept 64.3 5.75413 11.17458 0.000031 Hours studied 4.6 1.24097 0.010008 a. State the appropriate null and alternative hypotheses to test if there is a linear relationship (measured by slope) between number of hours studied and the final exam score? b. Using the SPSS output above, state and label the value of the test statistic and the p-value for the test in part a
Step by Step Solution
There are 3 Steps involved in it

Get step-by-step solutions from verified subject matter experts