

Question: SUMMARY OUTPUT Regression Statistics Multiple R R Square 0.865 0.748 Adjusted R Square 0.726 Standard Error 5.195 Observations 50 ANOVA df SS MS F
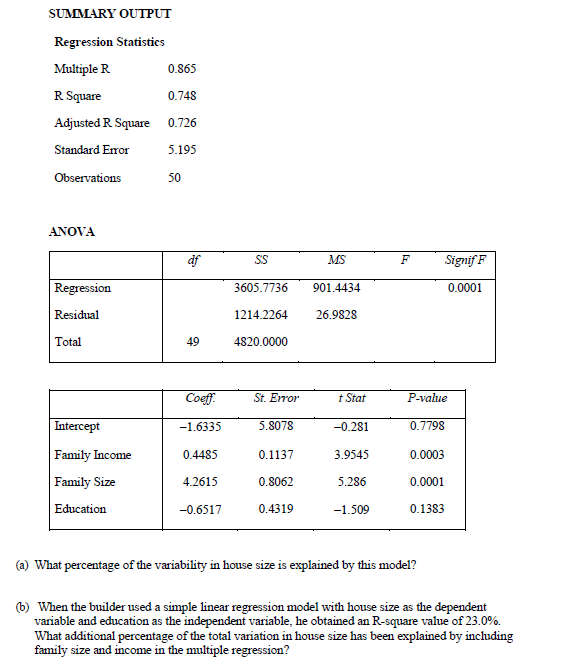
SUMMARY OUTPUT Regression Statistics Multiple R R Square 0.865 0.748 Adjusted R Square 0.726 Standard Error 5.195 Observations 50 ANOVA df SS MS F Signif F Regression Residual 3605.7736 901.4434 0.0001 1214.2264 26.9828 Total 49 4820.0000 Coeff St. Error t Stat P-value Intercept -1.6335 5.8078 -0.281 0.7798 Family Income 0.4485 0.1137 3.9545 0.0003 Family Size 4.2615 0.8062 5.286 0.0001 Education -0.6517 0.4319 -1.509 0.1383 (a) What percentage of the variability in house size is explained by this model? (b) When the builder used a simple linear regression model with house size as the dependent variable and education as the independent variable, he obtained an R-square value of 23.0%. What additional percentage of the total variation in house size has been explained by including family size and income in the multiple regression?
Step by Step Solution
There are 3 Steps involved in it
It seems I still dont have access to ... View full answer

Get step-by-step solutions from verified subject matter experts