

Question: Summary: reading a regression model / analysis . This study aims to assess the energy efficiency of residential buildings by examining their heating and cooling
Summary: reading a regression modelanalysis
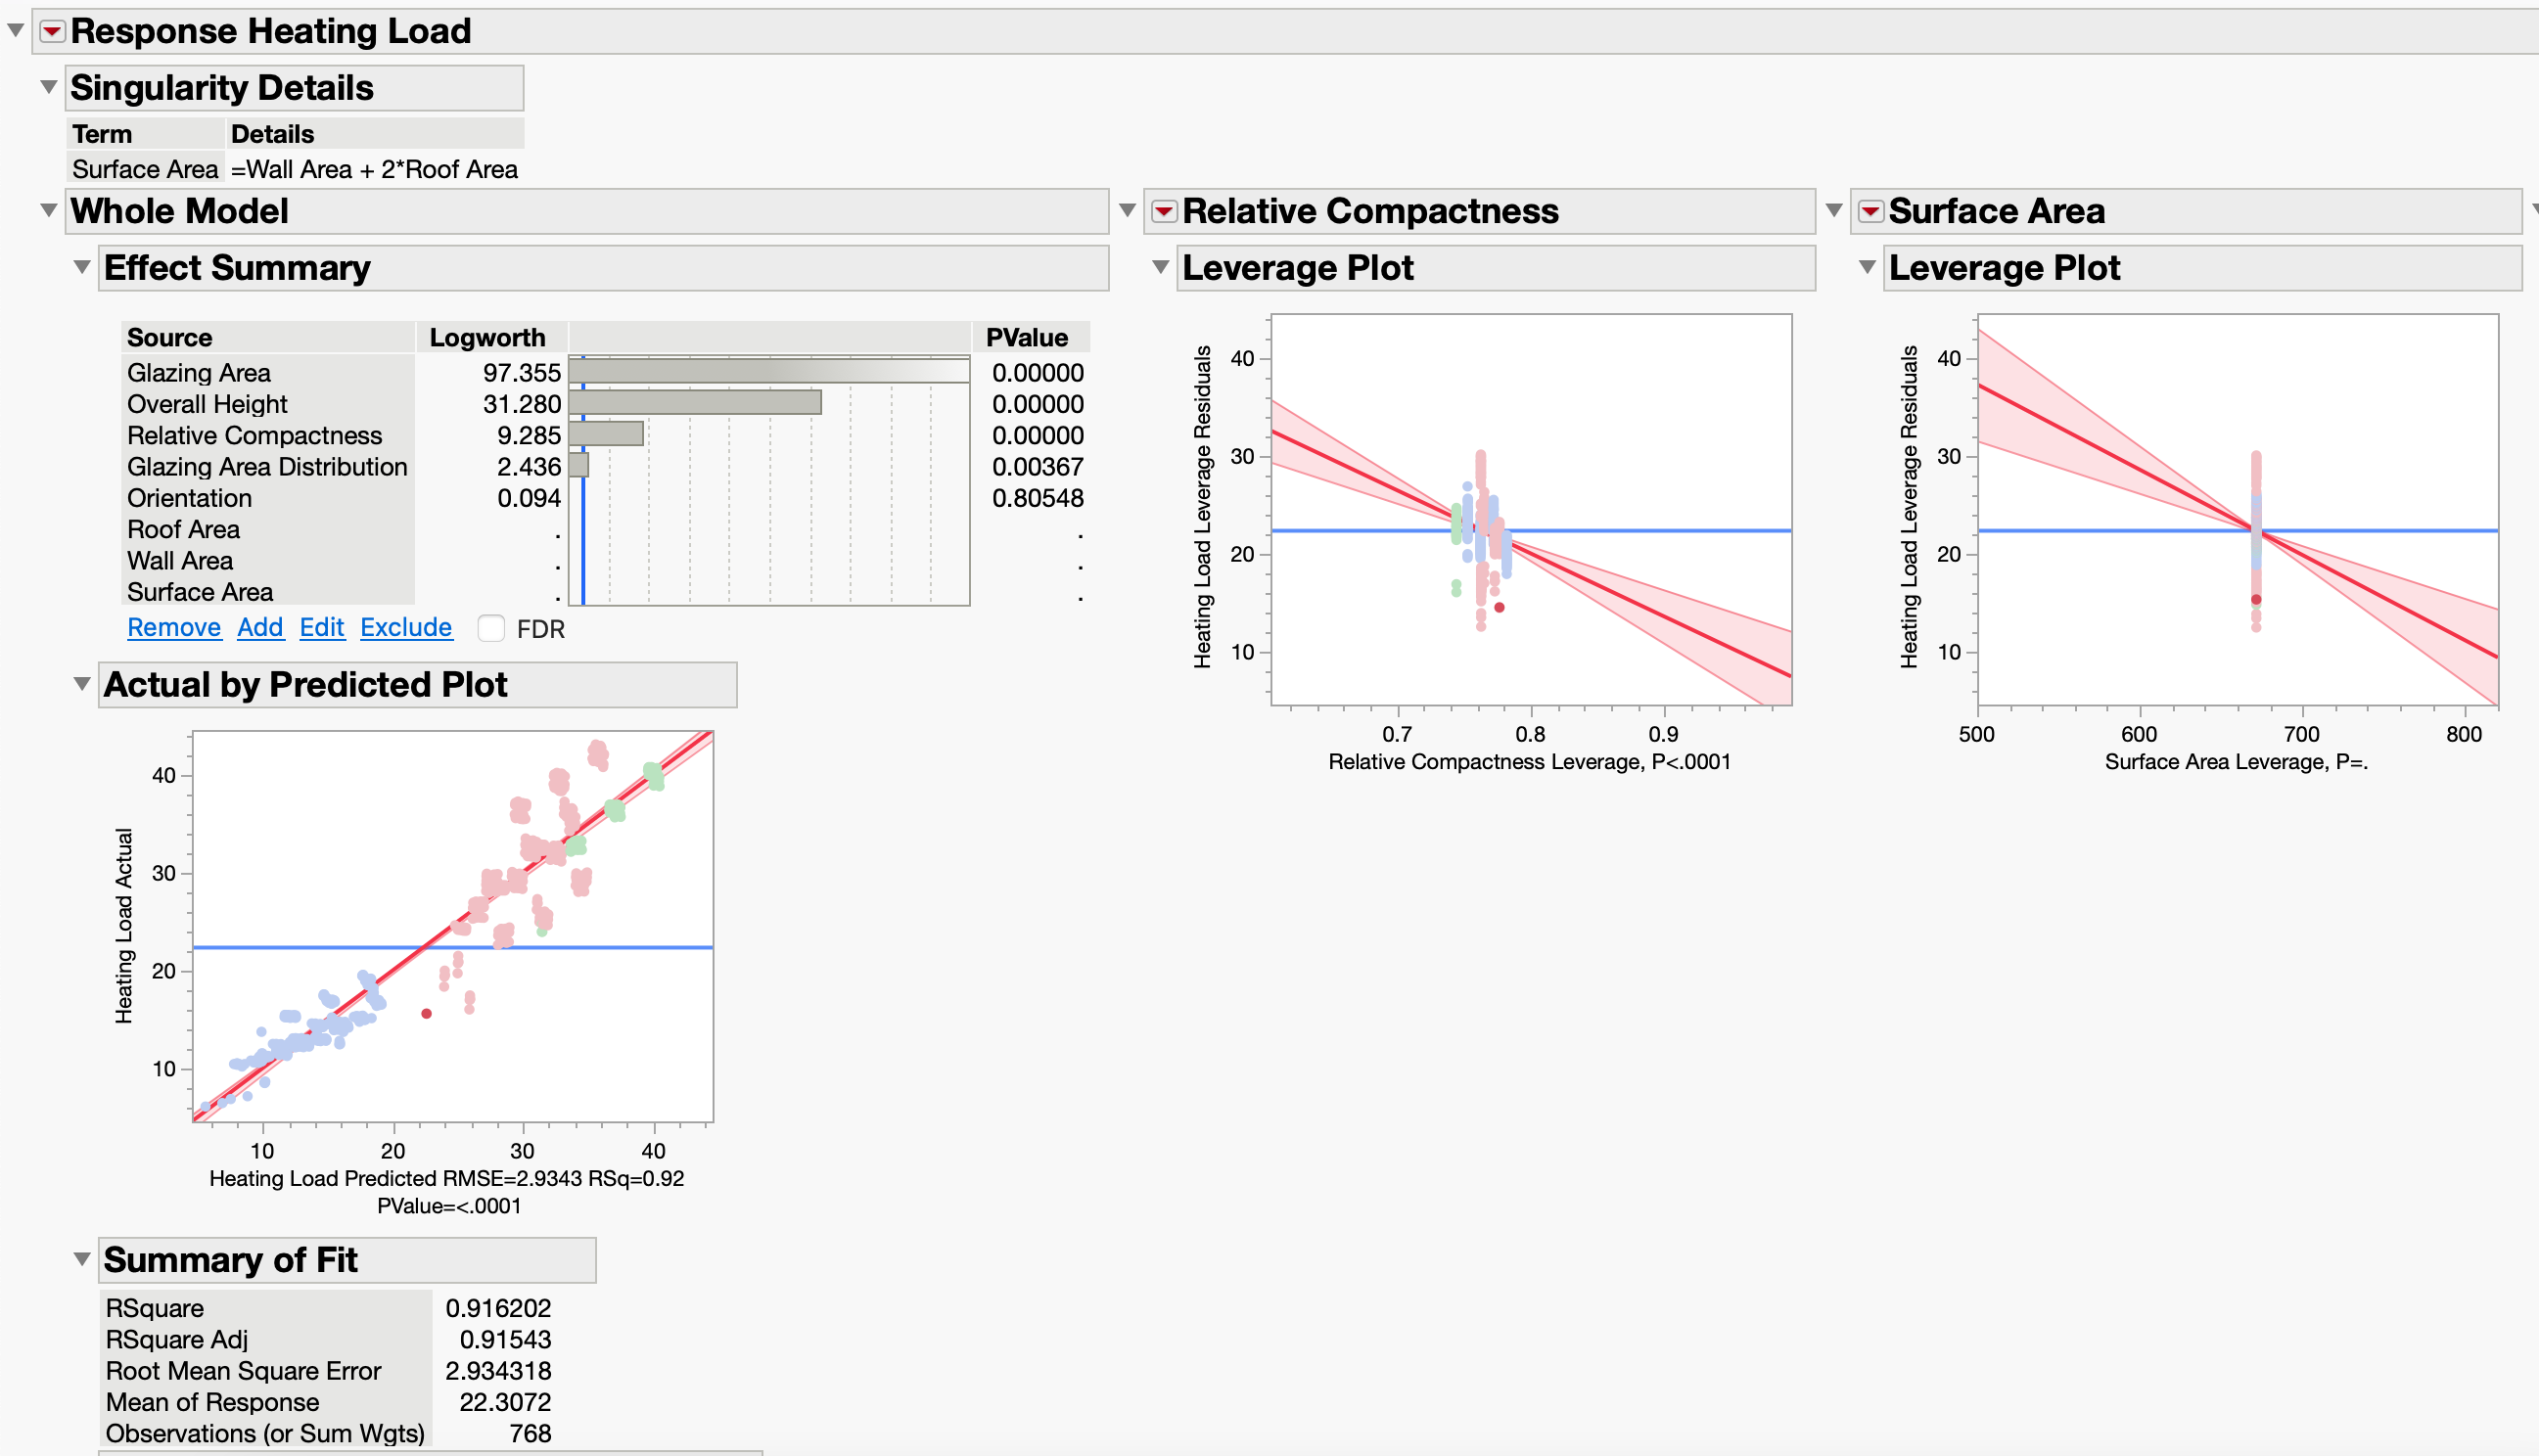
This study aims to assess the energy efficiency of residential buildings by examining their heating and cooling load requirements. Using Ecotect software, twelve distinct building shapes are simulated, resulting in a dataset ofsimulated building shapes with distinct features. This dataset is used to predict two realvalued outcomes: heating load and cooling load. The variables present in the dataset, along with their descriptions, are summarized in below Table:
Variable Name vs Description
XRelative Compactness
XSurface Area
XWall Area
XRoof Area
XOverall Height
XOrientation
XGlazing Area
XGlazing Area Distribution
YHeating Load
YCooling Load
Questions:
After creating a regression analysis for the variables in response to heating load, what observations, conclusions andor patterns can you make for the different variables from reviewing the regression images attached?
Secondly looking at the PValue for each of these variables in the image attached, what observations can you make? Which PValue is the most significant variable and why?
Lastly one of the images show the predicted regression formula. What conclusions can you make form the equation? How does this show the effect of one independent variable on the dependent variable?This study aims to assess the energy efficiency of residential buildings by examining their heating and cooling load requirements. Using Ecotect software, twelve distinct building shapes are simulated, resulting in a dataset ofsimulated building shapes with distinct features. This dataset is used to predict two realvalued outcomes: heating load and cooling load. The variables present in the dataset, along with their descriptions, are summarized in below Table:
Variable Name vs Description
XRelative Compactness
XSurface Area
XWall Area
XRoof Area
XOverall Height
XOrientation
XGlazing Area
XGlazing Area Distribution
YHeating Load
YCooling Load
Questions:
After creating a regression analysis for the variables in response to heating load, what observations, conclusions andor patterns can you make for the different variables from reviewing the regression images attached?
Secondly looking at the PValue for each of these variables in the image attached, what observations can you make? Which PValue is the most significant variable and why?
Lastly one of the images show the predicted regression formula. What conclusions can you make form the equation? How does this show the effect of one independent variable on the dependent variable heating load
Step by Step Solution
There are 3 Steps involved in it
1 Expert Approved Answer
Step: 1 Unlock

Question Has Been Solved by an Expert!
Get step-by-step solutions from verified subject matter experts
Step: 2 Unlock
Step: 3 Unlock