

Question: Summary statistics of the simulation results are: Minimum Maximum Mean Std. Dev. Values -1.9006 2.7551 0.3785 0.6168 10,000 i. Write down an appropriate Excel function

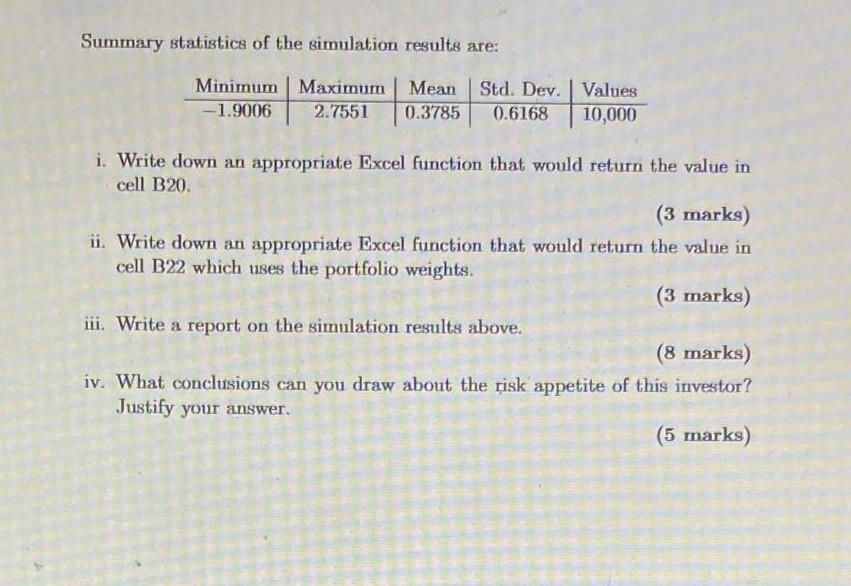
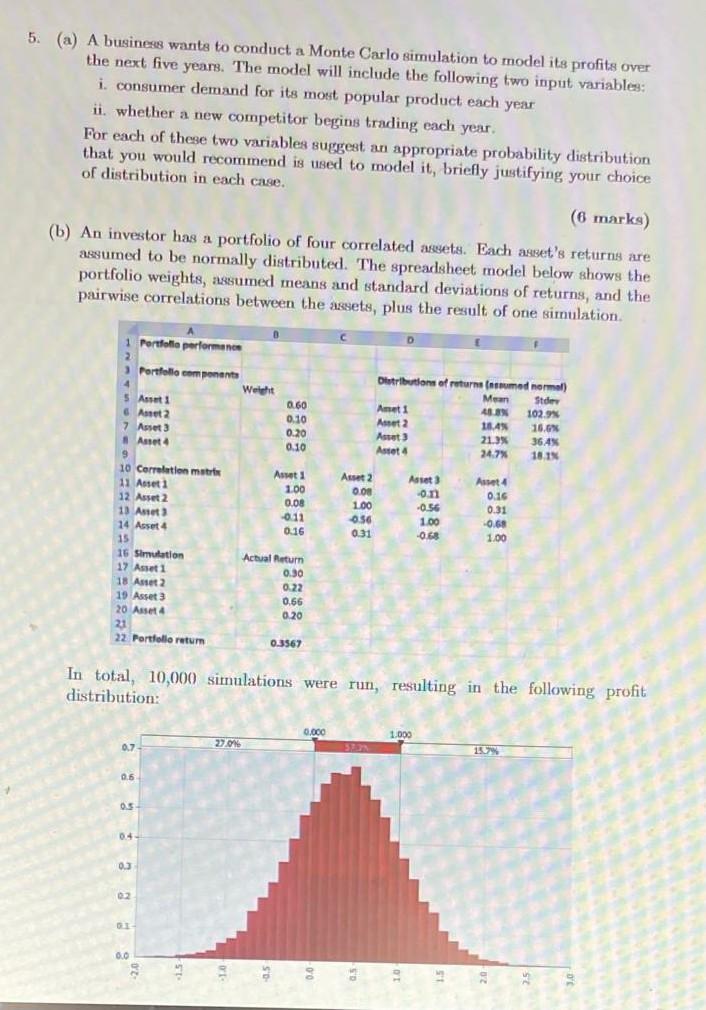
Summary statistics of the simulation results are: Minimum Maximum Mean Std. Dev. Values -1.9006 2.7551 0.3785 0.6168 10,000 i. Write down an appropriate Excel function that would return the value in cell B20. (3 marks) ii. Write down an appropriate Excel function that would return the value in cell B22 which uses the portfolio weights. (3 marks) iii. Write a report on the simulation results above. (8 marks) iv. What conclusions can you draw about the risk appetite of this investor? Justify your answer. (5 marks) Summary statistics of the simulation results are: Minimum Maximum Mean Std. Dev. Values -1.9006 2.7551 0.3785 0.6168 10,000 i. Write down an appropriate Excel function that would return the value in cell B20. (3 marks) ii. Write down an appropriate Excel function that would return the value in cell B22 which uses the portfolio weights. (3 marks) iii. Write a report on the simulation results above. (8 marks) iv. What conclusions can you draw about the risk appetite of this investor? Justify your answer. (5 marks) 5. (a) A business wants to conduct a Monte Carlo simulation to model its profits over the next five years. The model will include the following two input variables: i. consumer demand for its most popular product each year ii. whether a new competitor begins trading each year. For each of these two variables suggest an appropriate probability distribution that you would recommend is used to model it, briefly justifying your choice of distribution in each case. (6 marks) (b) An investor has a portfolio of four correlated assets. Each asset's returns are assumed to be normally distributed. The spreadsheet model below shows the portfolio weights, assumed means and standard deviations of returns, and the pairwise correlations between the assets, plus the result of one simulation. B C D Portfolio performance Portfello components Distributions of returns (assumed normal) Mean Stdev 5 Asset 1 0.60 Amet 1 48.8% 102.9% 6 Asset 2 0.10 Asset 2 18.4% 16.6% 7 Asset 3 0.20 Asset 3 21.3% 36.4% Asset 4 0.10 Asset 4 24.7% 18.1% 9 10 Correlation matrix Asset 1 Asset 2 Asset 3 Asset 4 11 Asset 1 1.00 0.08 -0.11 0.16 12 Asset 2 0.08 1.00 -0.56 0.31 13 Asset 3 -0.11 -0.56 1.00 -0.68 14 Asset 4 0.16 0.31 -0.68 1.00 15 16 Simulation Actual Return 17 Asset 1 0.30 18 Asset 2 0.22 19 Asset 3 0.66 20 Asset 4 0.20 21 22 Portfolio return 0.3567 In total, 10,000 simulations were run, resulting in the following profit distribution: 0.000 1.000 27.0% 37,3% 15.7% 0.7 0.6 0.5- 0.4 0.3 01- 0.0 Weight Summary statistics of the simulation results are: Minimum Maximum Mean Std. Dev. Values -1.9006 2.7551 0.3785 0.6168 10,000 i. Write down an appropriate Excel function that would return the value in cell B20. (3 marks) ii. Write down an appropriate Excel function that would return the value in cell B22 which uses the portfolio weights. (3 marks) iii. Write a report on the simulation results above. (8 marks) iv. What conclusions can you draw about the risk appetite of this investor? Justify your answer. (5 marks) Summary statistics of the simulation results are: Minimum Maximum Mean Std. Dev. Values -1.9006 2.7551 0.3785 0.6168 10,000 i. Write down an appropriate Excel function that would return the value in cell B20. (3 marks) ii. Write down an appropriate Excel function that would return the value in cell B22 which uses the portfolio weights. (3 marks) iii. Write a report on the simulation results above. (8 marks) iv. What conclusions can you draw about the risk appetite of this investor? Justify your answer. (5 marks) 5. (a) A business wants to conduct a Monte Carlo simulation to model its profits over the next five years. The model will include the following two input variables: i. consumer demand for its most popular product each year ii. whether a new competitor begins trading each year. For each of these two variables suggest an appropriate probability distribution that you would recommend is used to model it, briefly justifying your choice of distribution in each case. (6 marks) (b) An investor has a portfolio of four correlated assets. Each asset's returns are assumed to be normally distributed. The spreadsheet model below shows the portfolio weights, assumed means and standard deviations of returns, and the pairwise correlations between the assets, plus the result of one simulation. B C D Portfolio performance Portfello components Distributions of returns (assumed normal) Mean Stdev 5 Asset 1 0.60 Amet 1 48.8% 102.9% 6 Asset 2 0.10 Asset 2 18.4% 16.6% 7 Asset 3 0.20 Asset 3 21.3% 36.4% Asset 4 0.10 Asset 4 24.7% 18.1% 9 10 Correlation matrix Asset 1 Asset 2 Asset 3 Asset 4 11 Asset 1 1.00 0.08 -0.11 0.16 12 Asset 2 0.08 1.00 -0.56 0.31 13 Asset 3 -0.11 -0.56 1.00 -0.68 14 Asset 4 0.16 0.31 -0.68 1.00 15 16 Simulation Actual Return 17 Asset 1 0.30 18 Asset 2 0.22 19 Asset 3 0.66 20 Asset 4 0.20 21 22 Portfolio return 0.3567 In total, 10,000 simulations were run, resulting in the following profit distribution: 0.000 1.000 27.0% 37,3% 15.7% 0.7 0.6 0.5- 0.4 0.3 01- 0.0 Weight
Step by Step Solution
There are 3 Steps involved in it
1 Expert Approved Answer
Step: 1 Unlock

Question Has Been Solved by an Expert!
Get step-by-step solutions from verified subject matter experts
Step: 2 Unlock
Step: 3 Unlock