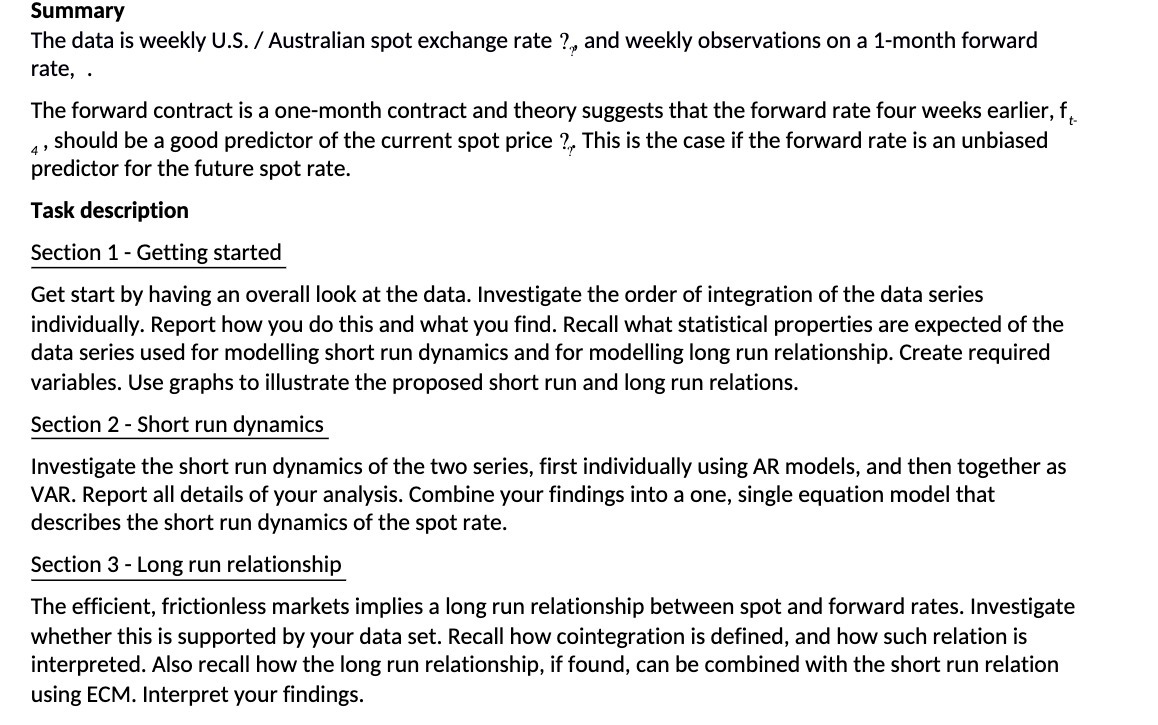
Question: Summary The data is weekly U.S. / Australian spot exchange rate ?._, and weekly observations on a 1-month forward rate, . The forward contract is

Summary The data is weekly U.S. / Australian spot
Summary The data is weekly U.S. / Australian spot exchange rate ?._, and weekly observations on a 1-month forward rate, . The forward contract is a one-month contract and theory suggests that the forward rate four weeks earlier, f,_ 4 , should be a good predictor of the current spot price ?._,. This is the case if the forward rate is an unbiased predictor for the future spot rate. Task description Section 1 - Getting started Get start by having an overall look at the data. Investigate the order of integration of the data series individually. Report how you do this and what you find. Recall what statistical properties are expected of the data series used for modelling short run dynamics and for modelling long run relationship. Create required variables. Use graphs to illustrate the proposed short run and long run relations. Section 2 - Short run dynamics Investigate the short run dynamics of the two series, first individually using AR models, and then together as VAR. Report all details of your analysis. Combine your findings into a one, single equation model that describes the short run dynamics of the spot rate. Section 3 - Long run relationship The efficient, frictionless markets implies a long run relationship between spot and forward rates. Investigate whether this is supported by your data set. Recall how cointegration is defined, and how such relation is interpreted. Also recall how the long run relationship, if found, can be combined with the short run relation using ECM. Interpret your findings

Step by Step Solution

There are 3 Steps involved in it

1 Expert Approved Answer
Step: 1 Unlock blur-text-image
Question Has Been Solved by an Expert!

Get step-by-step solutions from verified subject matter experts

Step: 2 Unlock
Step: 3 Unlock

Students Have Also Explored These Related Finance Questions!