

Question: Summary This assignment asks you to use the techniques that you have learned in this course to evaluate a potential investment opportunity. Specifically, it asks
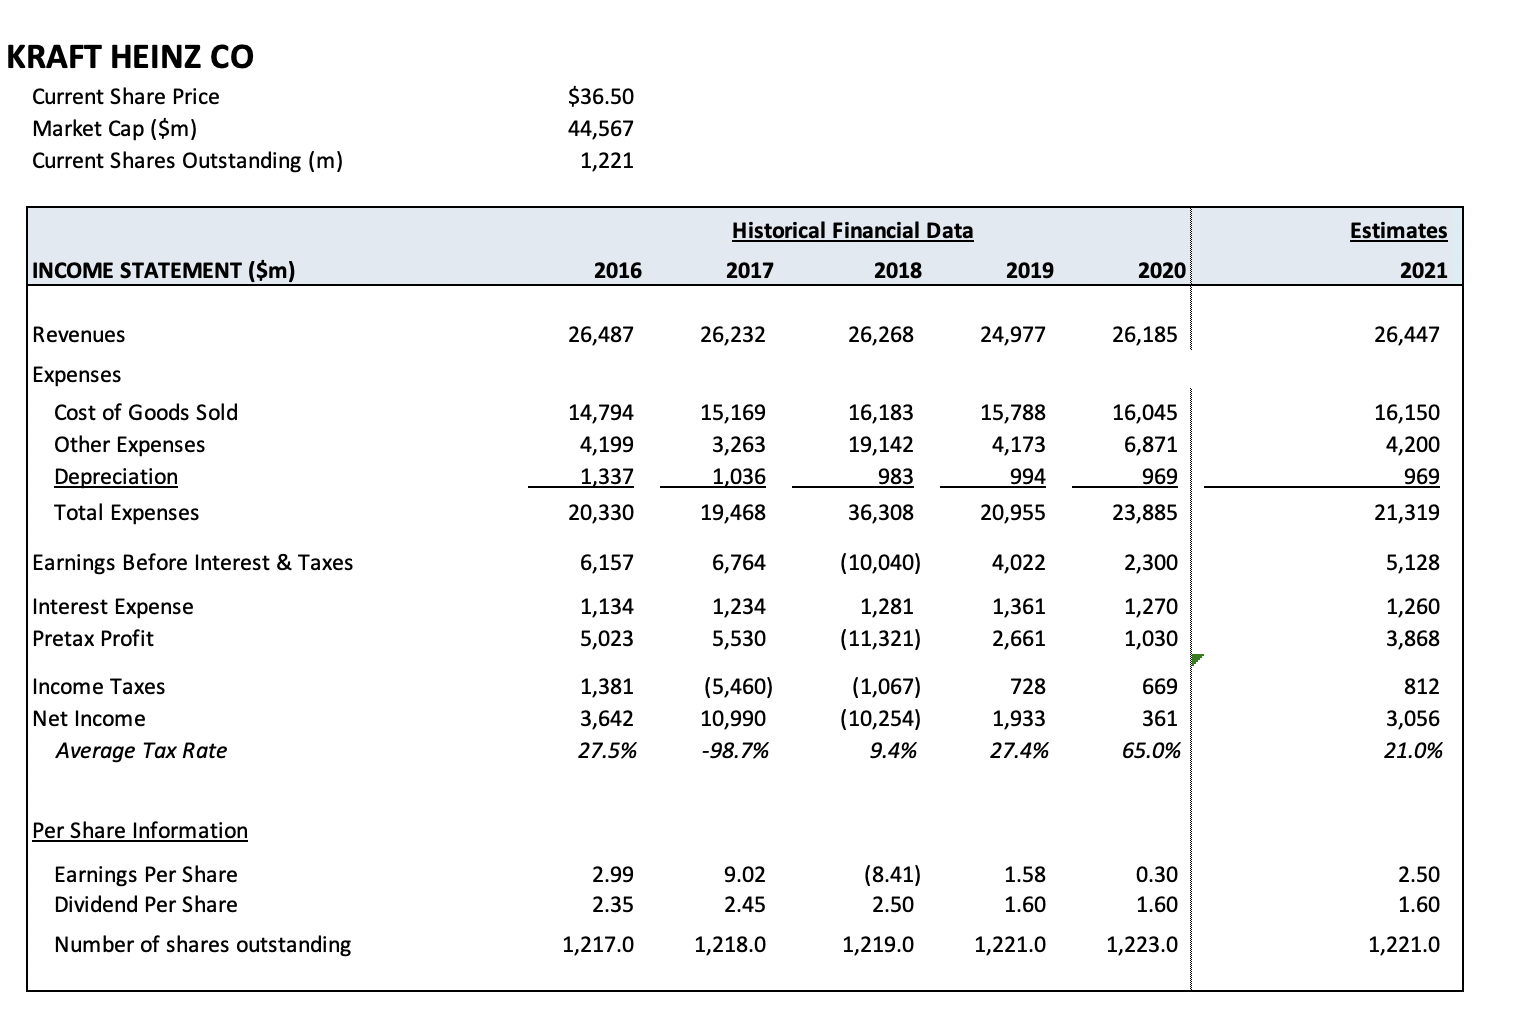
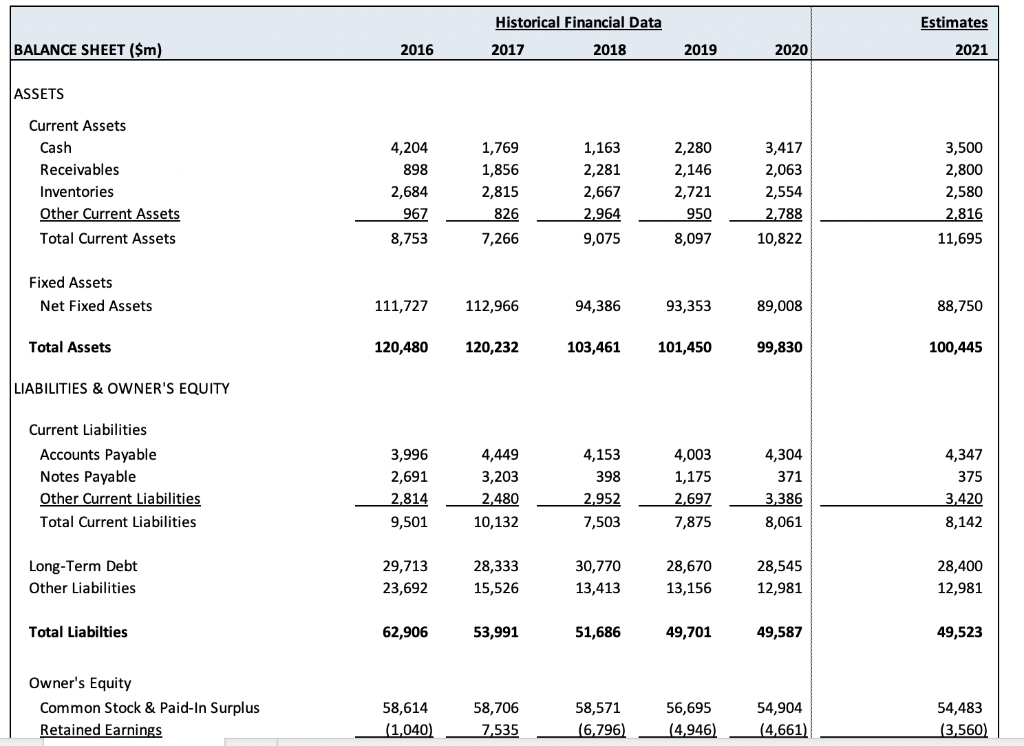
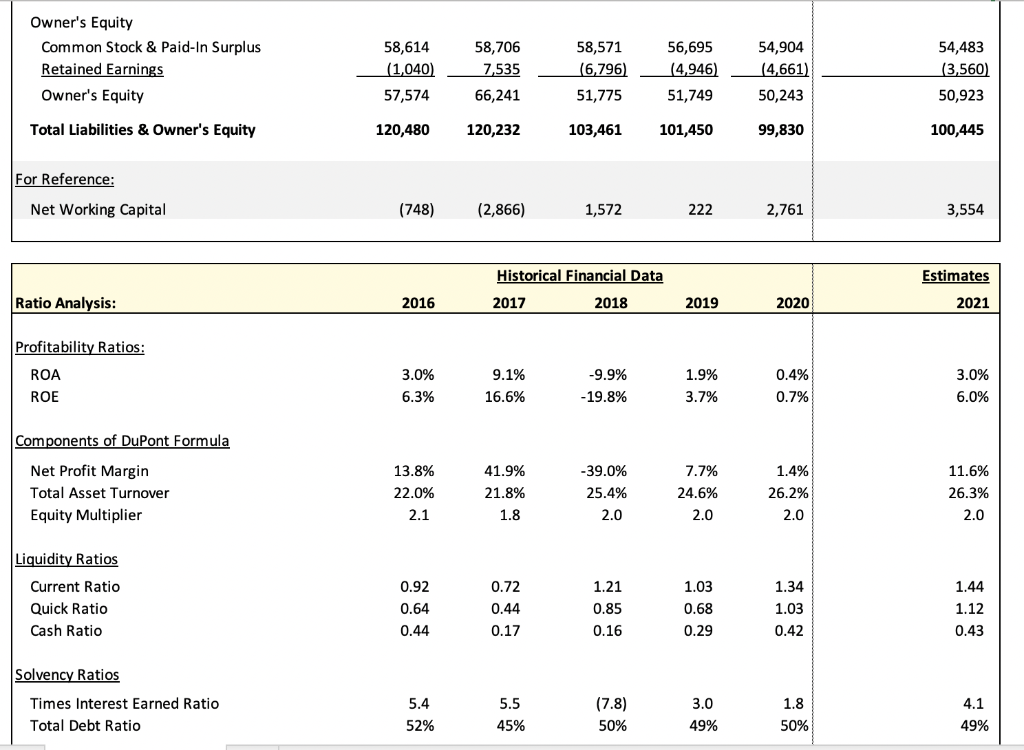
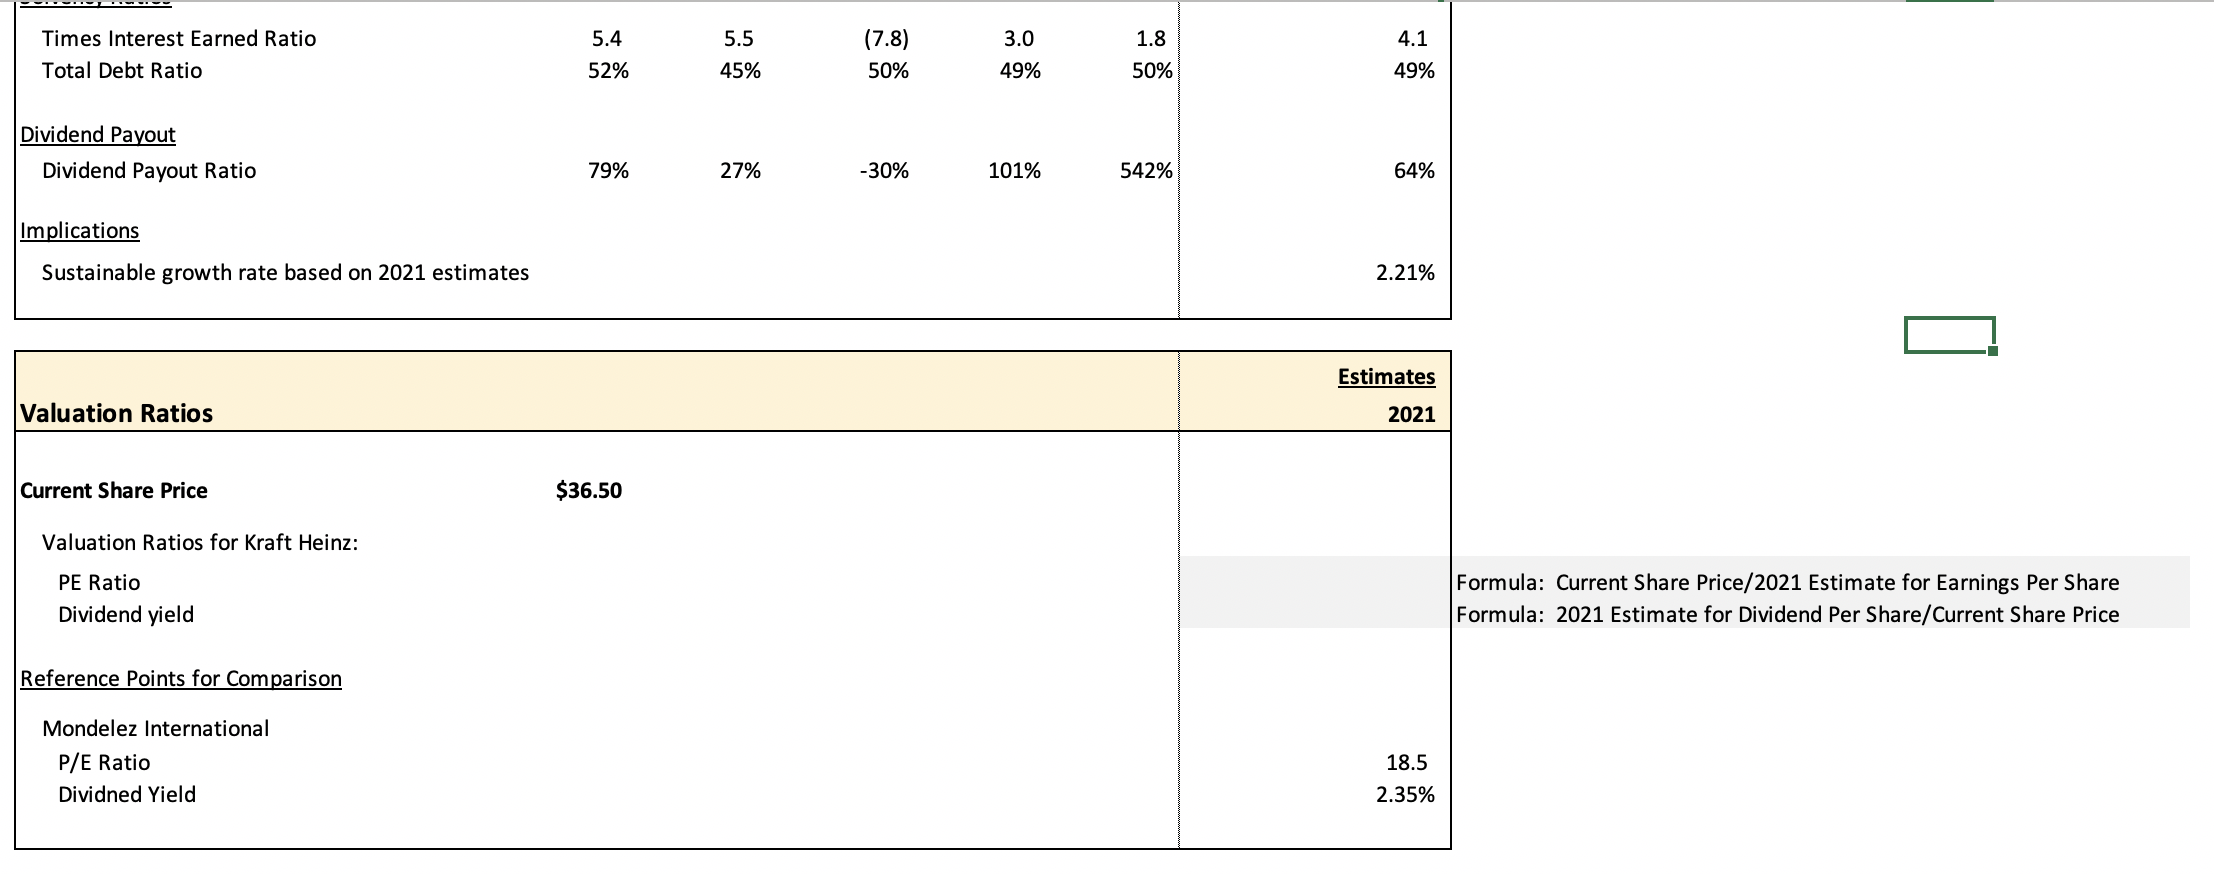
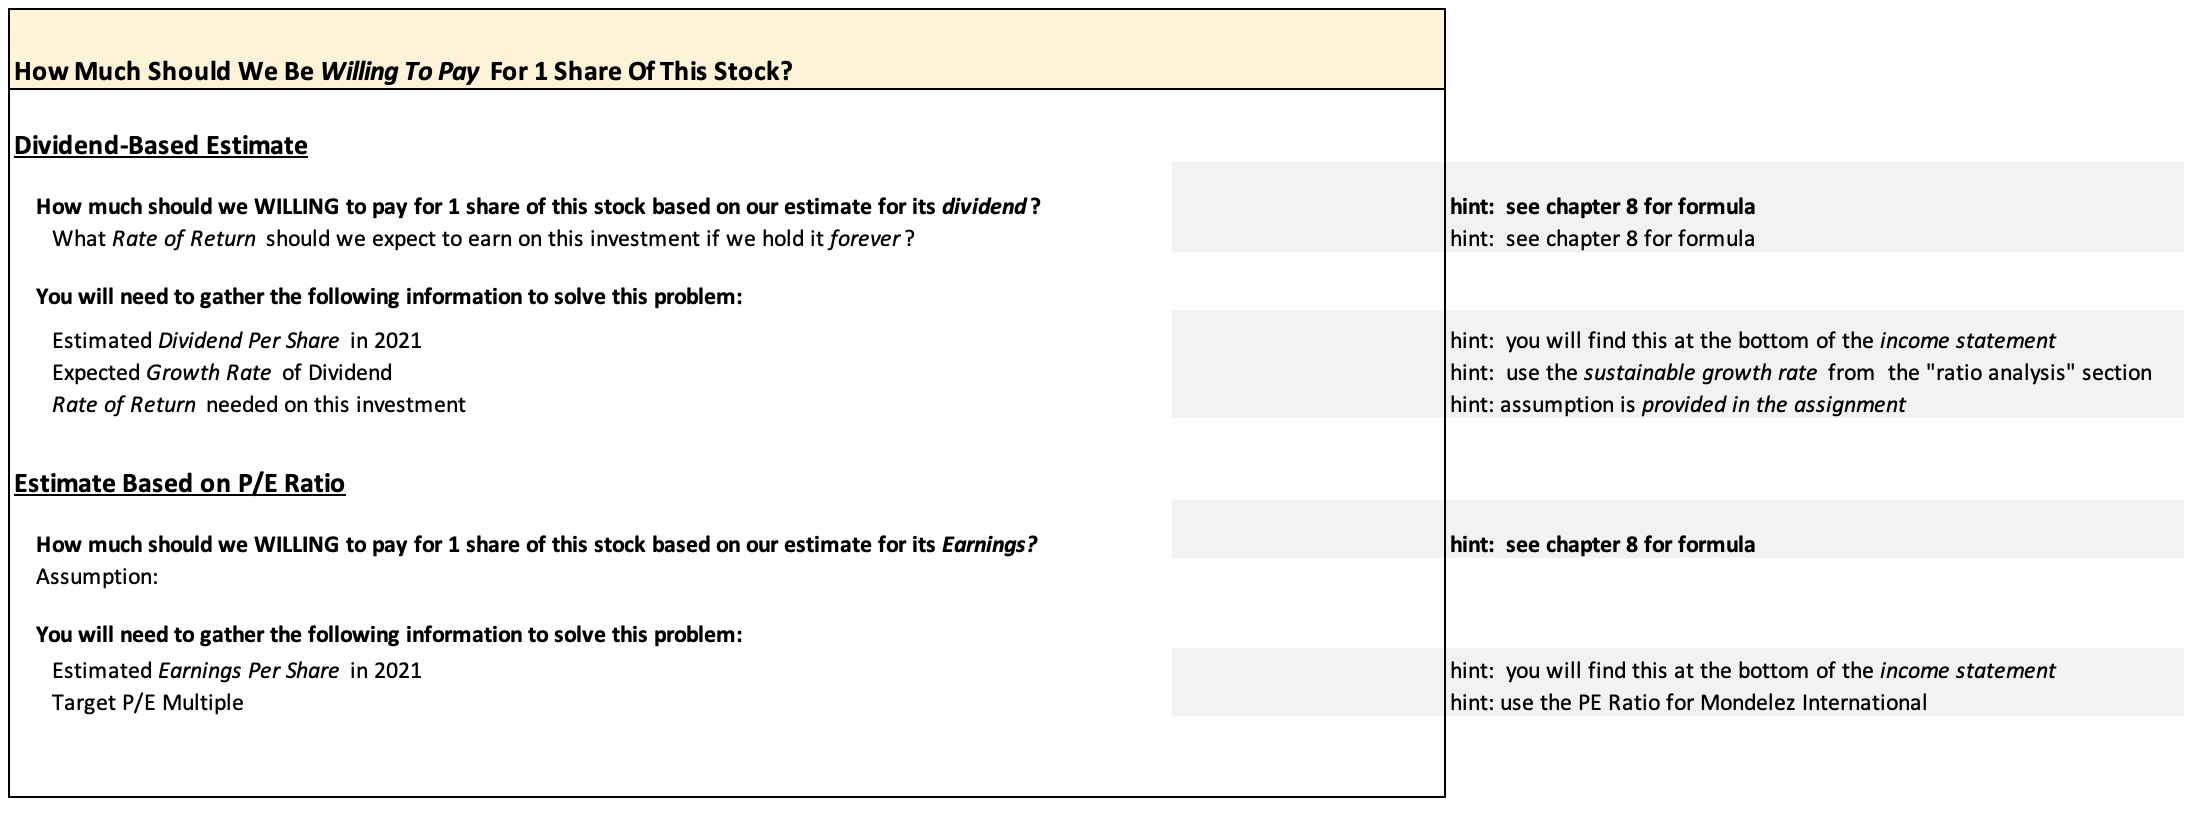
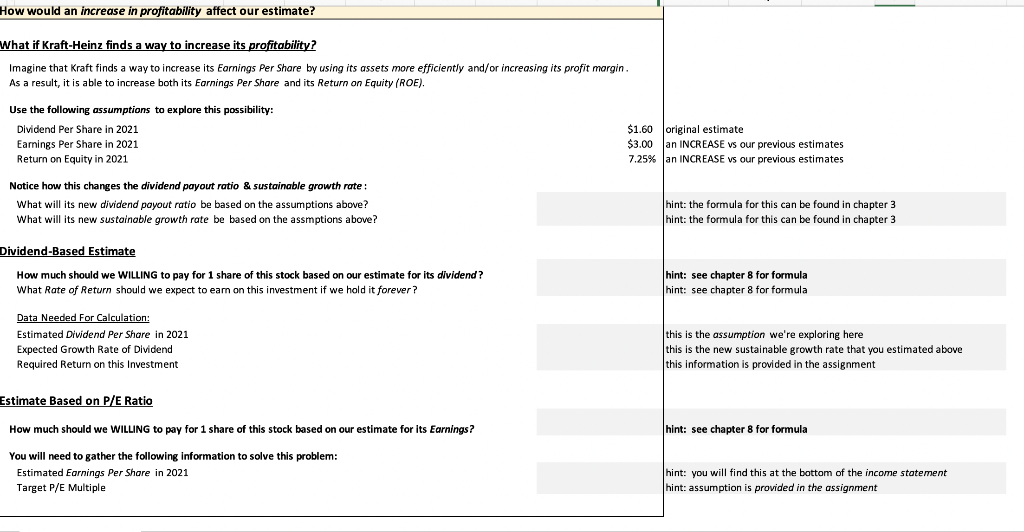
Summary This assignment asks you to use the techniques that you have learned in this course to evaluate a potential investment opportunity. Specifically, it asks you to use the data provided with this assignment to determine how much you would be willing to pay for one share of stock in The Kraft Heinz Company (KHC), and to offer an opinion on whether we should consider investing in this company at its current share price. You do NOT have to do any independent research to complete this assignment: The company's financial data has been provided for you in the spreadsheet that goes with this assignment; The spreadsheet also contains estimates for the company's 2021 earnings and dividends that you will be asked to use in your analysis; The writeup below also offers a bit of history and background on Kraft in order to help you form an opinion. Please use the spreadsheet provided with this assignment to complete your analysis, and write up your conclusions in a brief memo of NO MORE THAN 1 page. Both the spreadsheet and memo should be turned in on D2L by Friday, March 12h. Step 1: Analysis In order to form an opinion of this stock, please take a moment to review the data provided in the spreadsheet: Simplified Financial Data for the years 2016-2020 Estimates for 2021 Key Ratios Begin by making some observations: Can you see any trends in the data that might give us hope that this company has the potential to increase its profitability in the future? Can you see any trends in its liquidity & solvency ratios that affect your opinion of this company's risk? How do the P/E Ratio and Dividend Yield for this stock compare against those of its competitor Mondelez International (MDLZ)? What is your opinion of this company based on this analysis? Step 2: Estimation Now use the space provided at the bottom of the spreadsheet to estimate how much you would be willing to pay for this stock based on the estimates you've been given for 2021: Technique #1: Dividend-Based Valuation How much should we be willing to pay for this company if we expect the dividend to be $1.60 in 2021 and need a rate of return of 7.0% on this investment? Note: you will need to calculate the sustainable growth rate of this company using the 2021 estimates in order to have all the information needed for this formula. Technique #2: Earnings-Based Valuation How much should we be willing to pay for this company if we believe that it can trade at the same PE Ratio as its competitor Mondelez International (MDLZ)? Note: Mondelez currently has a PE Ratio of 18.5 (data provided in spreadsheet). Think about what you how to interpret these calculations: would you be willing to buy 1 share of The Kraft Heinz Company at $36.50 based on these estimates? KRAFT HEINZ CO Current Share Price Market Cap ($m) Current Shares Outstanding (m) $36.50 44,567 1,221 Historical Financial Data Estimates INCOME STATEMENT ($m) 2016 2017 2018 2019 2020 2021 Revenues 26,487 26,232 26,268 24,977 26,185 26,447 Expenses Cost of Goods Sold Other Expenses Depreciation Total Expenses 14,794 4,199 1,337 20,330 15,169 3,263 1,036 19,468 16,183 19,142 983 36,308 15,788 4,173 994 20,955 16,045 6,871 969 16,150 4,200 969 21,319 23,885 Earnings Before Interest & Taxes 6,157 6,764 (10,040) 4,022 2,300 5,128 Interest Expense Pretax Profit 1,134 5,023 1,234 5,530 1,281 (11,321) 1,361 2,661 1,270 1,030 1,260 3,868 Income Taxes Net Income 1,381 3,642 27.5% (5,460) 10,990 -98.7% (1,067) (10,254) 9.4% 728 1,933 27.4% 669 361 65.0% 812 3,056 21.0% Average Tax Rate Per Share Information Earnings Per Share Dividend Per Share 2.99 2.35 9.02 2.45 (8.41) 2.50 1.58 1.60 .30 1.60 2.50 1.60 Number of shares outstanding 1,217.0 1,218.0 1,219.0 1,221.0 1,223.0 1,221.0 Historical Financial Data Estimates BALANCE SHEET ($m) 2016 2017 2018 2019 2020 2021 ASSETS Current Assets Cash Receivables Inventories Other Current Assets Total Current Assets 4,204 898 2,684 967 8,753 1,769 1,856 2,815 826 7,266 1,163 2,281 2,667 2.964 9,075 2,280 2,146 2,721 950 8,097 3,417 2,063 2,554 2.788 10,822 3,500 2,800 2,580 2.816 11,695 Fixed Assets Net Fixed Assets 111,727 112,966 94,386 93,353 89,008 88,750 Total Assets 120,480 120,232 103,461 101,450 99,830 100,445 LIABILITIES & OWNER'S EQUITY Current Liabilities Accounts Payable Notes Payable Other Current Liabilities Total Current Liabilities 3,996 2,691 2.814 9,501 4,449 3,203 2,480 10,132 4,153 398 2.952 7,503 4,003 1,175 2,697 7,875 4,304 371 3,386 8,061 4,347 375 3,420 8,142 Long-Term Debt Other Liabilities 29,713 23,692 28,333 15,526 30,770 13,413 28,670 13,156 28,545 12,981 28,400 12,981 Total Liabilties 62,906 53,991 51,686 49,701 49,587 49,523 Owner's Equity Common Stock & Paid-In Surplus Retained Earnings 58,614 (1,040) 58,706 7,535 58,571 (6.796) 56,695 (4.946) 54,904 (4,661) 54,483 (3,560) Owner's Equity Common Stock & Paid-In Surplus Retained Earnings Owner's Equity 58,614 (1,040) 57,574 58,706 7,535 58,571 (6,796) 56,695 (4,946) 51,749 54,904 (4,661) 50,243 54,483 (3,560) 50,923 66,241 51,775 Total Liabilities & Owner's Equity 120,480 120,232 103,461 101,450 99,830 100,445 For Reference: Net Working Capital (748) (2,866) 1,572 222 2,761 3,554 Historical Financial Data Estimates Ratio Analysis: 2016 2017 2018 2019 2020 2021 Profitability Ratios: ROA ROE 3.0% 6.3% 9.1% 16.6% -9.9% - 19.8% 1.9% 3.7% 0.4% 0.7% 3.0% 6.0% Components of DuPont Formula Net Profit Margin Total Asset Turnover Equity Multiplier 13.8% 22.0% 2.1 41.9% 21.8% 1.8 -39.0% 25.4% 2.0 7.7% 24.6% 2.0 1.4% 26.2% 2.0 11.6% 26.3% 2.0 Liquidity Ratios 1.03 Current Ratio Quick Ratio Cash Ratio 0.92 0.64 0.44 0.72 0.44 0.17 1.21 0.85 0.16 0.68 0.29 1.34 1.03 0.42 1.44 1.12 0.43 Solvency Ratios 4.1 Times Interest Earned Ratio Total Debt Ratio 5.4 52% 5.5 45% (7.8) 50% 3.0 49% 1.8 50% 49% 5.4 3.0 4.1 Times Interest Earned Ratio Total Debt Ratio 5.5 45% (7.8) 50% 1.8 50% 52% 49% 49% Dividend Payout Dividend Payout Ratio 79% 27% -30% 101% 542% 64% Implications Sustainable growth rate based on 2021 estimates 2.21% Estimates Valuation Ratios 2021 Current Share Price $36.50 Valuation Ratios for Kraft Heinz: PE Ratio Dividend yield Formula: Current Share Price/2021 Estimate for Earnings Per Share Formula: 2021 Estimate for Dividend Per Share/Current Share Price Reference Points for Comparison Mondelez International P/E Ratio Dividned Yield 18.5 2.35% How Much Should We Be Willing To Pay For 1 Share Of This Stock? Dividend-Based Estimate How much should we WILLING to pay for 1 share of this stock based on our estimate for its dividend? What Rate of Return should we expect to earn on this investment if we hold it forever? hint: see chapter 8 for formula hint: see chapter 8 for formula You will need to gather the following information to solve this problem: Estimated Dividend Per Share in 2021 Expected Growth Rate of Dividend Rate of Return needed on this investment hint: you will find this at the bottom of the income statement hint: use the sustainable growth rate from the "ratio analysis" section hint: assumption is provided in the assignment Estimate Based on P/E Ratio hint: see chapter 8 for formula How much should we WILLING to pay for 1 share of this stock based on our estimate for its Earnings? Assumption: You will need to gather the following information to solve this problem: Estimated Earnings Per Share in 2021 Target P/E Multiple hint: you will find this at the bottom of the income statement hint: use the PE Ratio for Mondelez International How would an increase in profitability affect our estimate? What if Kraft-Heinz finds a way to increase its profitability? Imagine that Kraft finds a way to increase its Earnings Per Share by using its assets more efficiently and/or increasing its profit margin. As a result, it is able to increase both its Earnings Per Share and its Return on Equity (ROE). Use the following assumptions to explore this possibility: Dividend Per Share in 2021 Earnings Per Share in 2021 Return on Equity in 2021 $1.60 original estimate $3.00 an INCREASE vs our previous estimates 7.25% Jan INCREASE vs our previous estimates Notice how this changes the dividend payout ratio & sustainable growth rate : What will its new dividend payout ratio be based on the assumptions above? What will its new sustainable growth rate be based on the assmptions above? hint: the formula for this can be found in chapter 3 hint: the formula for this can be found in chapter 3 Dividend-Based Estimate How much should we WILLING to pay for 1 share of this stock based on our estimate for its dividend? What Rate of Return should we expect to earn on this investment if we hold it forever? hint: see chapter 8 for formula hint: see chapter 8 for formula Data Needed For Calculation: Estimated Dividend Per Share in 2021 Expected Growth Rate of Dividend Required Return on this Investment this is the assumption we're exploring here this is the new sustainable growth rate that you estimated above this information is provided in the assignment Estimate Based on P/E Ratio How much should we WILLING to pay for 1 share of this stock based on our estimate for its Earnings? hint: see chapter 8 for formula You will need to gather the following information to solve this problem: Estimated Earnings Per Share in 2021 Target P/E Multiple hint: you will find this at the bottom of the income statement hint: assumption is provided in the assignment Summary This assignment asks you to use the techniques that you have learned in this course to evaluate a potential investment opportunity. Specifically, it asks you to use the data provided with this assignment to determine how much you would be willing to pay for one share of stock in The Kraft Heinz Company (KHC), and to offer an opinion on whether we should consider investing in this company at its current share price. You do NOT have to do any independent research to complete this assignment: The company's financial data has been provided for you in the spreadsheet that goes with this assignment; The spreadsheet also contains estimates for the company's 2021 earnings and dividends that you will be asked to use in your analysis; The writeup below also offers a bit of history and background on Kraft in order to help you form an opinion. Please use the spreadsheet provided with this assignment to complete your analysis, and write up your conclusions in a brief memo of NO MORE THAN 1 page. Both the spreadsheet and memo should be turned in on D2L by Friday, March 12h. Step 1: Analysis In order to form an opinion of this stock, please take a moment to review the data provided in the spreadsheet: Simplified Financial Data for the years 2016-2020 Estimates for 2021 Key Ratios Begin by making some observations: Can you see any trends in the data that might give us hope that this company has the potential to increase its profitability in the future? Can you see any trends in its liquidity & solvency ratios that affect your opinion of this company's risk? How do the P/E Ratio and Dividend Yield for this stock compare against those of its competitor Mondelez International (MDLZ)? What is your opinion of this company based on this analysis? Step 2: Estimation Now use the space provided at the bottom of the spreadsheet to estimate how much you would be willing to pay for this stock based on the estimates you've been given for 2021: Technique #1: Dividend-Based Valuation How much should we be willing to pay for this company if we expect the dividend to be $1.60 in 2021 and need a rate of return of 7.0% on this investment? Note: you will need to calculate the sustainable growth rate of this company using the 2021 estimates in order to have all the information needed for this formula. Technique #2: Earnings-Based Valuation How much should we be willing to pay for this company if we believe that it can trade at the same PE Ratio as its competitor Mondelez International (MDLZ)? Note: Mondelez currently has a PE Ratio of 18.5 (data provided in spreadsheet). Think about what you how to interpret these calculations: would you be willing to buy 1 share of The Kraft Heinz Company at $36.50 based on these estimates? KRAFT HEINZ CO Current Share Price Market Cap ($m) Current Shares Outstanding (m) $36.50 44,567 1,221 Historical Financial Data Estimates INCOME STATEMENT ($m) 2016 2017 2018 2019 2020 2021 Revenues 26,487 26,232 26,268 24,977 26,185 26,447 Expenses Cost of Goods Sold Other Expenses Depreciation Total Expenses 14,794 4,199 1,337 20,330 15,169 3,263 1,036 19,468 16,183 19,142 983 36,308 15,788 4,173 994 20,955 16,045 6,871 969 16,150 4,200 969 21,319 23,885 Earnings Before Interest & Taxes 6,157 6,764 (10,040) 4,022 2,300 5,128 Interest Expense Pretax Profit 1,134 5,023 1,234 5,530 1,281 (11,321) 1,361 2,661 1,270 1,030 1,260 3,868 Income Taxes Net Income 1,381 3,642 27.5% (5,460) 10,990 -98.7% (1,067) (10,254) 9.4% 728 1,933 27.4% 669 361 65.0% 812 3,056 21.0% Average Tax Rate Per Share Information Earnings Per Share Dividend Per Share 2.99 2.35 9.02 2.45 (8.41) 2.50 1.58 1.60 .30 1.60 2.50 1.60 Number of shares outstanding 1,217.0 1,218.0 1,219.0 1,221.0 1,223.0 1,221.0 Historical Financial Data Estimates BALANCE SHEET ($m) 2016 2017 2018 2019 2020 2021 ASSETS Current Assets Cash Receivables Inventories Other Current Assets Total Current Assets 4,204 898 2,684 967 8,753 1,769 1,856 2,815 826 7,266 1,163 2,281 2,667 2.964 9,075 2,280 2,146 2,721 950 8,097 3,417 2,063 2,554 2.788 10,822 3,500 2,800 2,580 2.816 11,695 Fixed Assets Net Fixed Assets 111,727 112,966 94,386 93,353 89,008 88,750 Total Assets 120,480 120,232 103,461 101,450 99,830 100,445 LIABILITIES & OWNER'S EQUITY Current Liabilities Accounts Payable Notes Payable Other Current Liabilities Total Current Liabilities 3,996 2,691 2.814 9,501 4,449 3,203 2,480 10,132 4,153 398 2.952 7,503 4,003 1,175 2,697 7,875 4,304 371 3,386 8,061 4,347 375 3,420 8,142 Long-Term Debt Other Liabilities 29,713 23,692 28,333 15,526 30,770 13,413 28,670 13,156 28,545 12,981 28,400 12,981 Total Liabilties 62,906 53,991 51,686 49,701 49,587 49,523 Owner's Equity Common Stock & Paid-In Surplus Retained Earnings 58,614 (1,040) 58,706 7,535 58,571 (6.796) 56,695 (4.946) 54,904 (4,661) 54,483 (3,560) Owner's Equity Common Stock & Paid-In Surplus Retained Earnings Owner's Equity 58,614 (1,040) 57,574 58,706 7,535 58,571 (6,796) 56,695 (4,946) 51,749 54,904 (4,661) 50,243 54,483 (3,560) 50,923 66,241 51,775 Total Liabilities & Owner's Equity 120,480 120,232 103,461 101,450 99,830 100,445 For Reference: Net Working Capital (748) (2,866) 1,572 222 2,761 3,554 Historical Financial Data Estimates Ratio Analysis: 2016 2017 2018 2019 2020 2021 Profitability Ratios: ROA ROE 3.0% 6.3% 9.1% 16.6% -9.9% - 19.8% 1.9% 3.7% 0.4% 0.7% 3.0% 6.0% Components of DuPont Formula Net Profit Margin Total Asset Turnover Equity Multiplier 13.8% 22.0% 2.1 41.9% 21.8% 1.8 -39.0% 25.4% 2.0 7.7% 24.6% 2.0 1.4% 26.2% 2.0 11.6% 26.3% 2.0 Liquidity Ratios 1.03 Current Ratio Quick Ratio Cash Ratio 0.92 0.64 0.44 0.72 0.44 0.17 1.21 0.85 0.16 0.68 0.29 1.34 1.03 0.42 1.44 1.12 0.43 Solvency Ratios 4.1 Times Interest Earned Ratio Total Debt Ratio 5.4 52% 5.5 45% (7.8) 50% 3.0 49% 1.8 50% 49% 5.4 3.0 4.1 Times Interest Earned Ratio Total Debt Ratio 5.5 45% (7.8) 50% 1.8 50% 52% 49% 49% Dividend Payout Dividend Payout Ratio 79% 27% -30% 101% 542% 64% Implications Sustainable growth rate based on 2021 estimates 2.21% Estimates Valuation Ratios 2021 Current Share Price $36.50 Valuation Ratios for Kraft Heinz: PE Ratio Dividend yield Formula: Current Share Price/2021 Estimate for Earnings Per Share Formula: 2021 Estimate for Dividend Per Share/Current Share Price Reference Points for Comparison Mondelez International P/E Ratio Dividned Yield 18.5 2.35% How Much Should We Be Willing To Pay For 1 Share Of This Stock? Dividend-Based Estimate How much should we WILLING to pay for 1 share of this stock based on our estimate for its dividend? What Rate of Return should we expect to earn on this investment if we hold it forever? hint: see chapter 8 for formula hint: see chapter 8 for formula You will need to gather the following information to solve this problem: Estimated Dividend Per Share in 2021 Expected Growth Rate of Dividend Rate of Return needed on this investment hint: you will find this at the bottom of the income statement hint: use the sustainable growth rate from the "ratio analysis" section hint: assumption is provided in the assignment Estimate Based on P/E Ratio hint: see chapter 8 for formula How much should we WILLING to pay for 1 share of this stock based on our estimate for its Earnings? Assumption: You will need to gather the following information to solve this problem: Estimated Earnings Per Share in 2021 Target P/E Multiple hint: you will find this at the bottom of the income statement hint: use the PE Ratio for Mondelez International How would an increase in profitability affect our estimate? What if Kraft-Heinz finds a way to increase its profitability? Imagine that Kraft finds a way to increase its Earnings Per Share by using its assets more efficiently and/or increasing its profit margin. As a result, it is able to increase both its Earnings Per Share and its Return on Equity (ROE). Use the following assumptions to explore this possibility: Dividend Per Share in 2021 Earnings Per Share in 2021 Return on Equity in 2021 $1.60 original estimate $3.00 an INCREASE vs our previous estimates 7.25% Jan INCREASE vs our previous estimates Notice how this changes the dividend payout ratio & sustainable growth rate : What will its new dividend payout ratio be based on the assumptions above? What will its new sustainable growth rate be based on the assmptions above? hint: the formula for this can be found in chapter 3 hint: the formula for this can be found in chapter 3 Dividend-Based Estimate How much should we WILLING to pay for 1 share of this stock based on our estimate for its dividend? What Rate of Return should we expect to earn on this investment if we hold it forever? hint: see chapter 8 for formula hint: see chapter 8 for formula Data Needed For Calculation: Estimated Dividend Per Share in 2021 Expected Growth Rate of Dividend Required Return on this Investment this is the assumption we're exploring here this is the new sustainable growth rate that you estimated above this information is provided in the assignment Estimate Based on P/E Ratio How much should we WILLING to pay for 1 share of this stock based on our estimate for its Earnings? hint: see chapter 8 for formula You will need to gather the following information to solve this problem: Estimated Earnings Per Share in 2021 Target P/E Multiple hint: you will find this at the bottom of the income statement hint: assumption is provided in the assignment
Step by Step Solution
There are 3 Steps involved in it

Get step-by-step solutions from verified subject matter experts