

Question: Supply Chain Management This is the second time submitting this question because the last person that answered is using the wrong data. Please use the
Supply Chain Management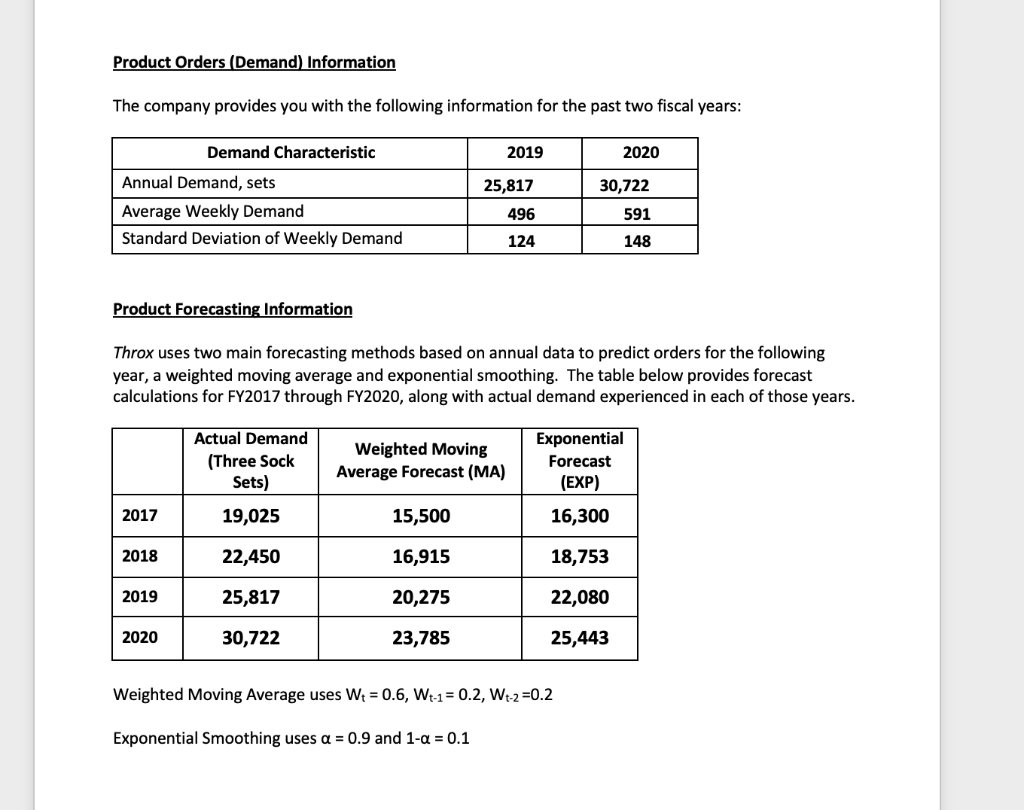
This is the second time submitting this question because the last person that answered is using the wrong data. Please use the data provided in the table.
For this question you will need to calculate 2 different EOQ and ROP values and interpret the results. For both EOQ and ROP, give your final answer in full sock sets (ROUND UP to the next whole number). The specific questions to answer are indicated in items a, b, and c below. Additional tips to calculate the EOQ and ROP are provided in the bullet points that follow.
Calculate EOQ and ROP for FY2020 based on the FY2020 forecast value that you determined to be most accurate in Question #1.
Calculate the EOQ and ROP based upon actual demand for FY2020
Use the total inventory cost calculation to determine total inventory costs for each of the three EOQ results: EOQ from part a, EOQ from part b, and the Q that Throx is currently using (given in the case). When determining the costs use 2020 actuals for your Demand (D) for all three scenarios.
Compare the total inventory costs from the three results and analyze what this shows you.
What are the implications of the ROP Throx is currently using versus the ROP based on Actual Demand?
Additional tips:
Use a service level of 95% (z = 1.65) when calculating the ROP.
For the standard deviation of weekly demand, use the data provided in the table on page 2 of the case with the FY2020 forecast for all approaches.
Annual Inventory management costs will include the following: Annual Holding Costs, Annual Ordering Costs, and Purchase Cost.
Product Orders (Demand) Information The company provides you with the following information for the past two fiscal years: [ Product Forecasting Information Throx uses two main forecasting methods based on annual data to predict orders for the following year, a weighted moving average and exponential smoothing. The table below provides forecast calculations for FY2017 through FY2020, along with actual demand experienced in each of those years. Weighted Moving Average uses Wt=0.6,Wt1=0.2,Wt2=0.2 Exponential Smoothing uses =0.9 and 1=0.1
Step by Step Solution
There are 3 Steps involved in it

Get step-by-step solutions from verified subject matter experts