

Question: Support department cost allocation-reciprocal services method Davis Snowflake & Co. produces Christmas stockings in its Cutting and Sewing departments. The Maintenance and Security departments support
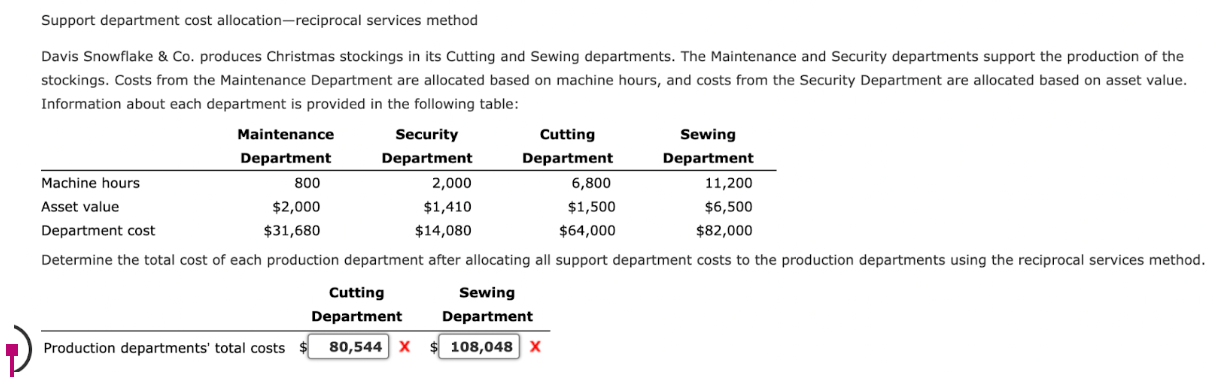
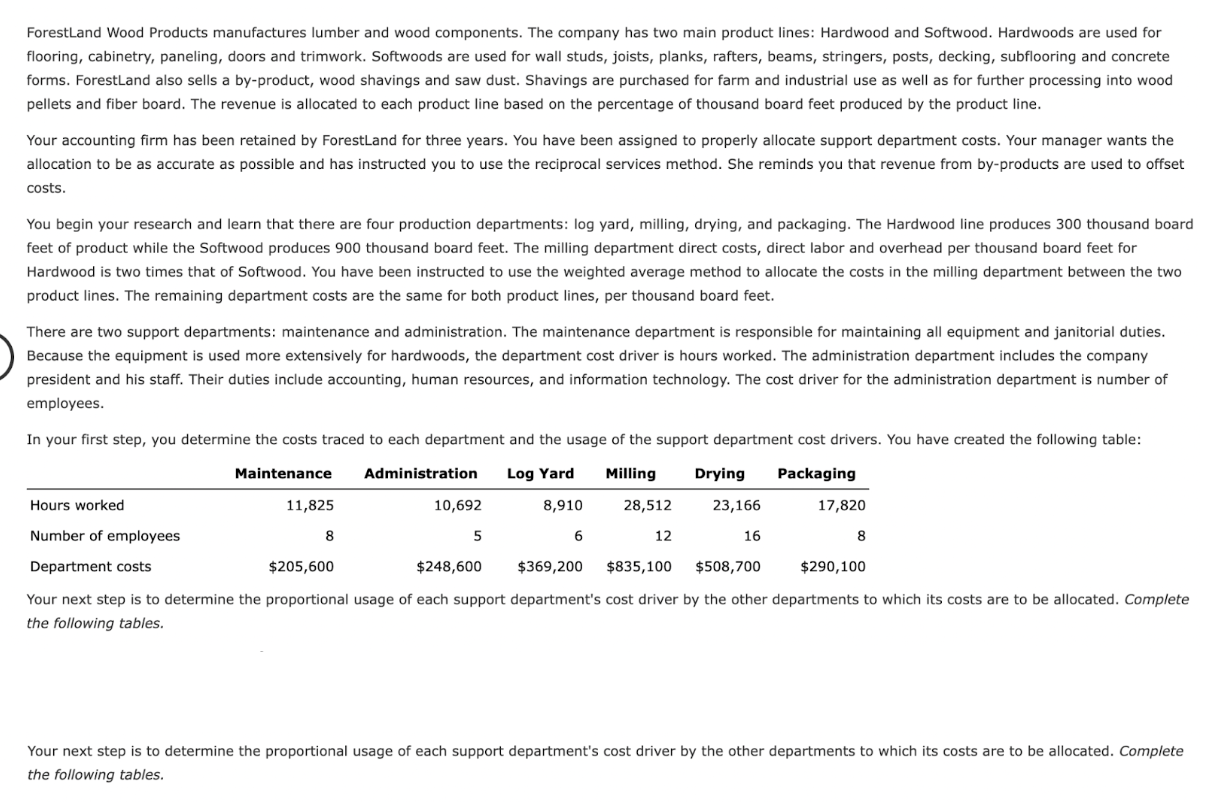
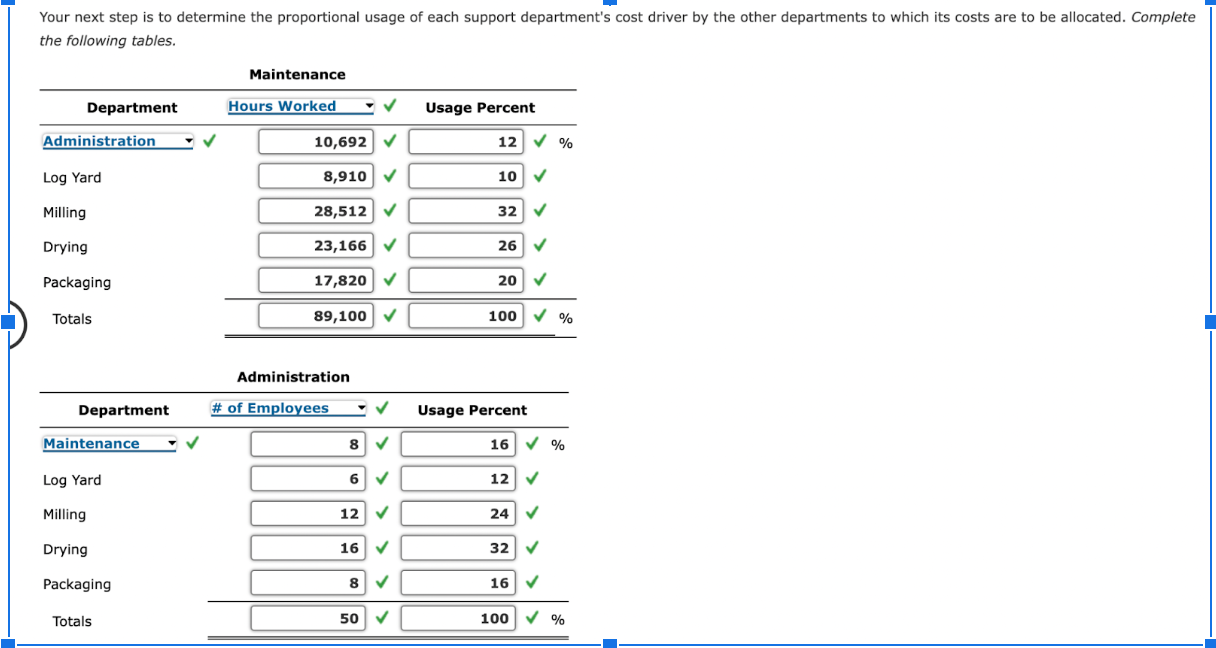
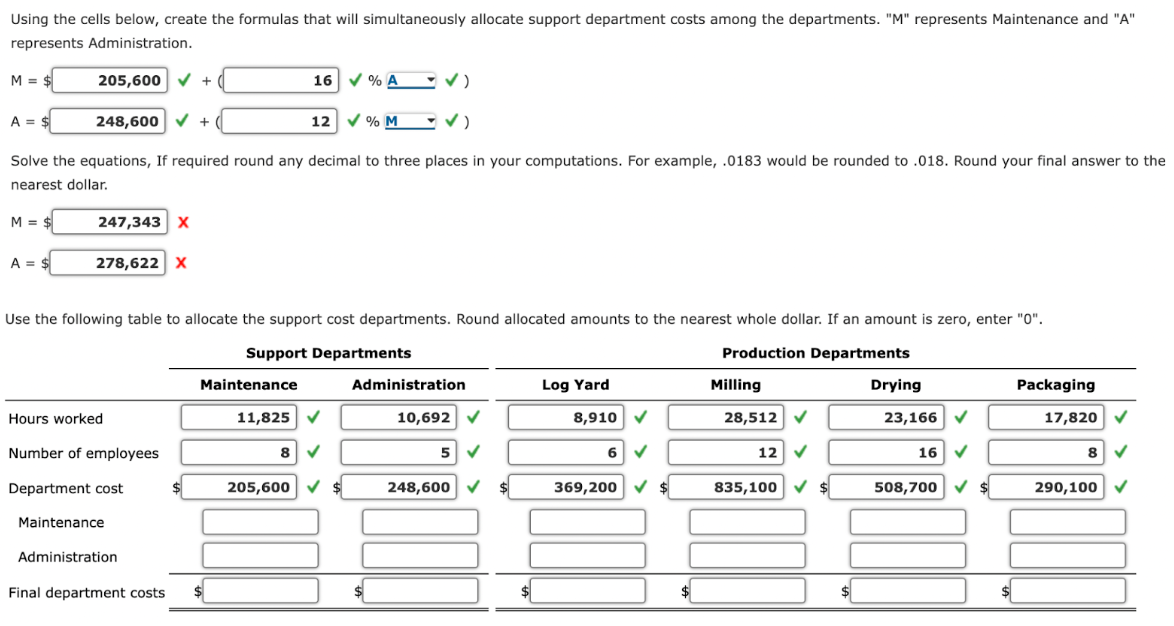
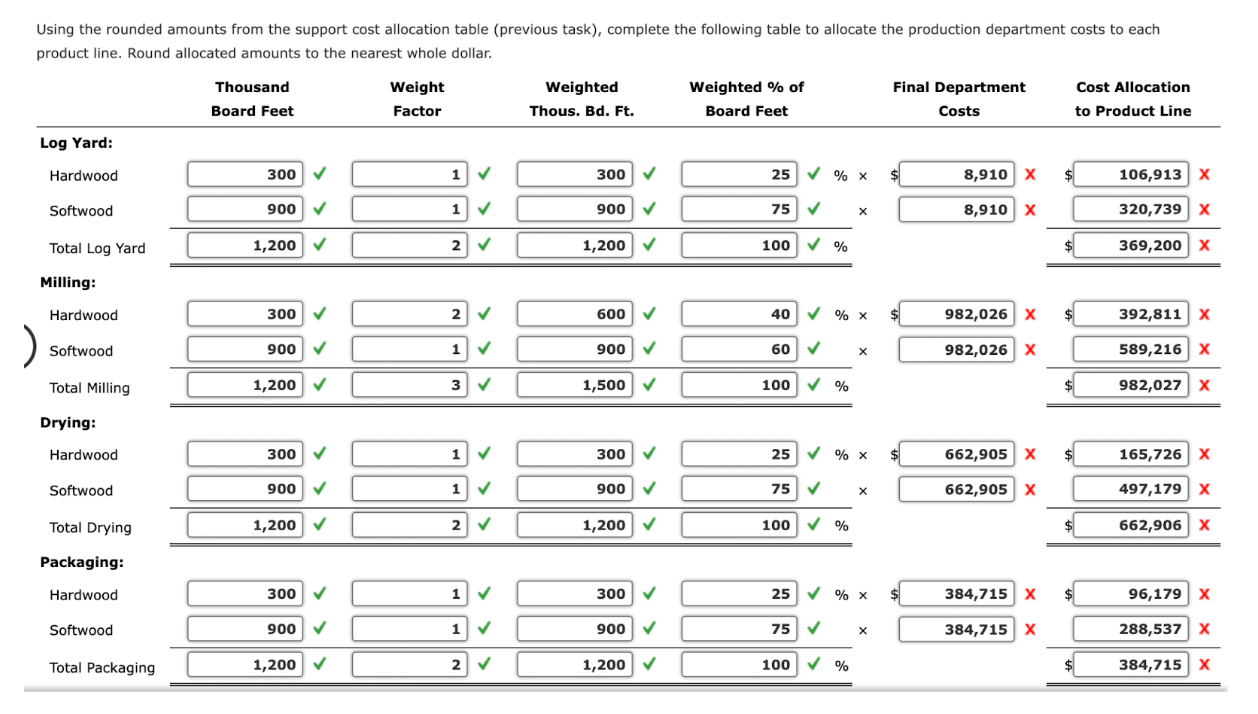
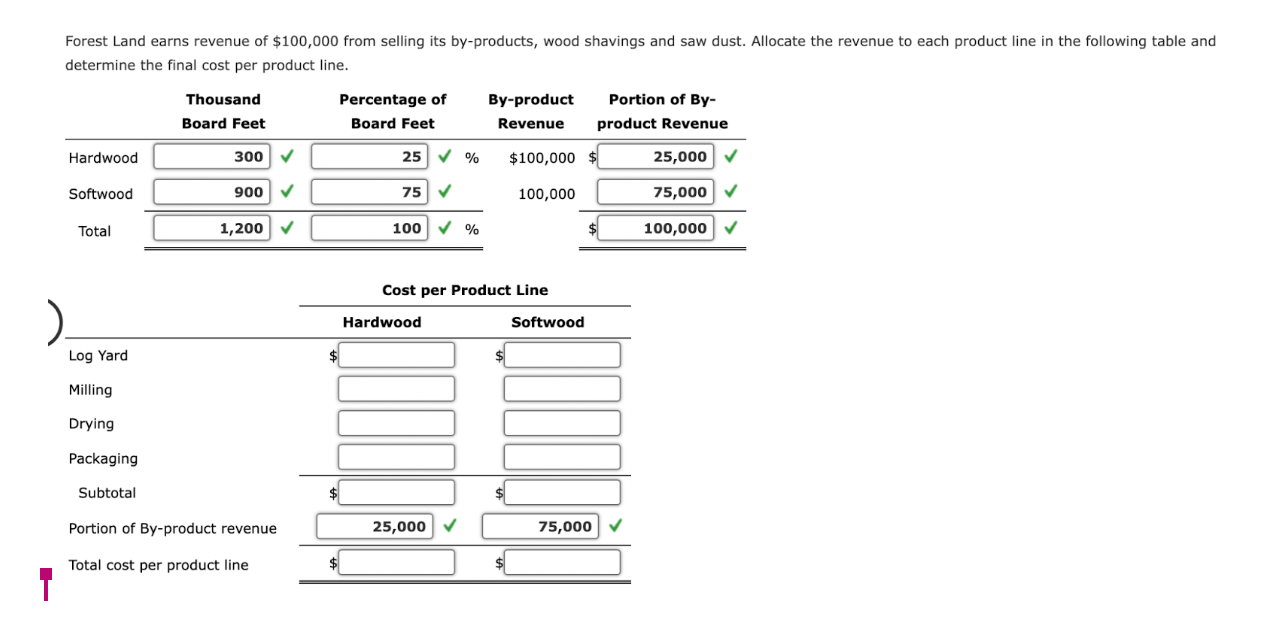
Support department cost allocation-reciprocal services method Davis Snowflake & Co. produces Christmas stockings in its Cutting and Sewing departments. The Maintenance and Security departments support the production of the stockings. Costs from the Maintenance Department are allocated based on machine hours, and costs from the Security Department are allocated based on asset value. Information about each department is provided in the following table: Maintenance Security Cutting Sewing Department Department Department Department Machine hours 800 2,000 6,800 11,200 Asset value $2,000 $1,410 $1,500 $6,500 Department cost $31,680 $14,080 $64,000 $82,000 Determine the total cost of each production department after allocating all support department costs to the production departments using the reciprocal services method. Cutting Sewing Department Department Production departments' total costs $ 80,544 X $ 108,048 XForestLand Wood Products manufactures lumber and wood components. The company has two main product lines: Hardwood and Softwood. Hardwoods are used for ooring, cabinetry, paneling, doors and trimwork. Soltwoods are used for wall studs, joists, planks, rafters, beams, stringers, posts, decking, suboon'ng and concrete forms. ForestLand also sells a by-product, wood shavings and saw dust. Shavings are purchased for farm and industrial use as well as for further processing into wood pellets and ber board. The revenue is allocated to each product line based on the percentage ofthousand board feet produced by the product line. Your aooounting rm has been retained by ForestLand for three years. You have been assigned to properly allocate support department costs. Your manager wants the allocation to be as accurate as possible and has Instructed you to use the reciprocal services method. She reminds you that revenue from byeproducts are used to oFfset costs. You begin your research and learn that there are four production departments: log yard, milling, drying, and packaging. The Hardwood line produces 300 thousand board feet of product while the Softwood produces 900 thousand board feet. The milling department direct oasis, direct labor and overhead per thousand board feet for Hardwood is two times that of Softwood. You have been instructed to use the weighted average method to allocate the costs in the milling department between the two product lines. The remaining department costs are the same for both product lines, per thousand board feet. There are two support departments: maintenance and administration. The maintenance department is responsible For maintaining ail equipment and janitorial duties. Because the equipment is used more extensively for hardwoods, the department cost driver is hours worked. The administration department includes the company president and hls staff. Thelr duties include accounting, human resources, and information technology. The cost driver for the administration department is number of employees. in your rst step, you determine the costs traced to each department and the usage of the support department cost drivers. You have created the following table: Maintenance Administration Log Yard Milling Drying Peel-raging Hours worked 1 1,825 10,692 3,910 23,512 23,166 17,020 Number of employees 8 5 6 12 16 8 Department costs $205,600 $240,600 $369,200 $835.100 $508,700 $290,100 Your next step is to determine the proportional usage of each support department's cost driver by the other departments to which its costs are to be allocated. Complete the following tables. Your next step is to detem'iine the proportional usage of each support department's cost driver by the other departments to which its costs are to be allocated. Complete the following tables. Your next step is to determine the proportional usage of each support department's cost driver by the other departments to which its costs are to be allocated. Complete the following tables. Maintenance Department Hours Worked V Usage Percent Administration 10,692 12 Log Yard 8,910 10 Milling 28,512 32 Drying 23,166 26 Packaging 17,820 20 Totals 89,100 100 V % Administration Department # of Employees Usage Percent Maintenance 8 16 /o Log Yard 6 12 Milling 12 24 Drying 16 32 Packaging 8 16 Totals 50 100 VUsing the cells below, create the formulas that will simultaneously allocate support department costs among the departments. "M" represents Maintenance and "A" represents Administration. M = $ 205,600 16 V % A - v) A = 248,600 + 12 V % M V ) Solve the equations, If required round any decimal to three places in your computations. For example, .0183 would be rounded to .018. Round your final answer to the nearest dollar. M = $ 247,343 X A = $ 278,622 X Use the following table to allocate the support cost departments. Round allocated amounts to the nearest whole dollar. If an amount is zero, enter "0". Support Departments Production Departments Maintenance Administration Log Yard Milling Drying Packaging Hours worked 11,825 10,692 8,910 28,512 23,166 17,820 Number of employees 5 6 12 16 8 Department cost 205,600 248,600 369,200 835,100 508,700 290,100 Maintenance Administration Final department costs $Using the rounded amounts from the support cost allocation table (previous task), complete the following table to allocate the production department costs to each product line. Round allocated amounts to the nearest whole dollar. Thousand Weight Weighted Weighted % of Final Department Cost Allocation Board Feet Factor Thous. Bd. Ft. Board Feet Costs to Product Line Log Yard: Hardwood 300 300 25 % X $ 8,910 X 106,913 X Softwood 900 900 75 X 8,910 X 320,739 X Total Log Yard 1,200 V 2 V 1,200 V 100 V % 369,200 X Milling: Hardwood 300 2 600 40 X 982,026 X $ 392,811 X Softwood 900 1 V 900 60 X 982,026 X 589,216 X Total Milling 1,200 V 3 V 1,500 V 100 % $ 982,027 X Drying: Hardwood 300 1 300 25 % X $ 662,905 X $ 165,726 X Softwood 900 1 V 900 75 X 662,905 X 497,179 X Total Drying 1,200 V 2 V 1,200 V 100 V % 662,906 X Packaging: Hardwood 300 1 300 25 $ 384,715 X $ 96,179 X Softwood 900 1 900 75 X 384,715 X 288,537 X Total Packaging 1,200 V 2 V 1,200 V 100 V % 384,715 XForest Land earns revenue of $100,000 from selling its by-products, wood shavings and saw dust. Allocate the revenue to each product line in the following table and determine the final cost per product line. Thousand Percentage of By-product Portion of By- Board Feet Board Feet Revenue product Revenue Hardwood 300 25 V % $100,000 $ 25,000 Softwood 900 75 100,000 75,000 Total 1,200 V 100 V % $ 100,000 Cost per Product Line Hardwood Softwood Log Yard Milling Drying Packaging Subtotal Portion of By-product revenue 25,000 75,000 Total cost per product line
Step by Step Solution
There are 3 Steps involved in it

Get step-by-step solutions from verified subject matter experts