

Question: Suppose a is the standard normal variable. Draw the normal curve for each of the following probability statements to visualize the required area. Report answers
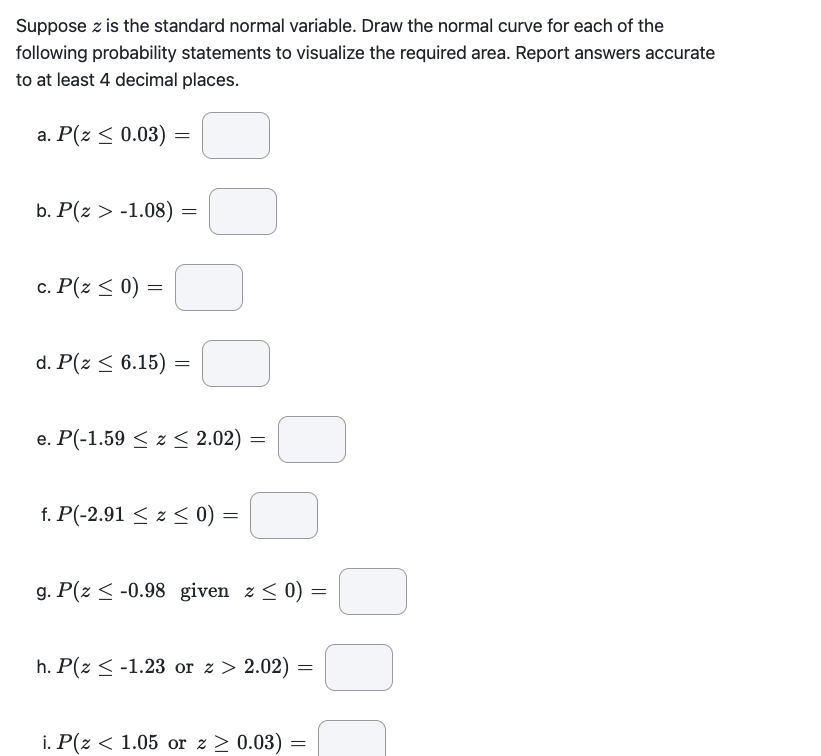
Suppose a is the standard normal variable. Draw the normal curve for each of the following probability statements to visualize the required area. Report answers accurate to at least 4 decimal places. a. P(z g 0.03) = l l b. PL: 2: -1.08) = i i c.P(zD)=i i a. P(z g 0.15) = l i e. P(-1.59 5 z i 2-02) = i i r. P(-2.01 g .2: g 0] = l i g_ PL: g -0.98 given 2' E D) = i i h. P(z g -1.23 or z > 2.02) : l l i. P(z <: or z>
Step by Step Solution
There are 3 Steps involved in it
1 Expert Approved Answer
Step: 1 Unlock

Question Has Been Solved by an Expert!
Get step-by-step solutions from verified subject matter experts
Step: 2 Unlock
Step: 3 Unlock