

Question: Suppose a new climate is heading toward both a higher average temperature and greater variation. Statistically represented here with the graph showing a higher mean
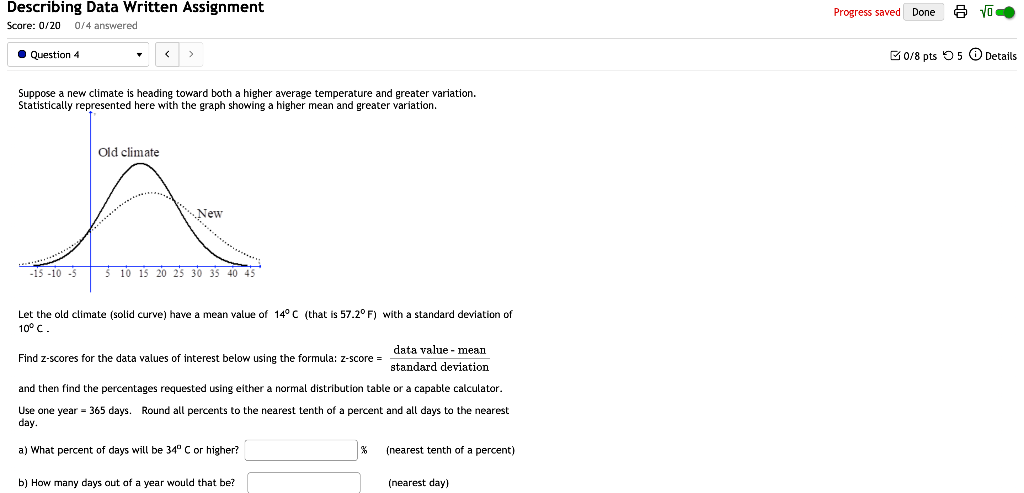
Suppose a new climate is heading toward both a higher average temperature and greater variation. Statistically represented here with the graph showing a higher mean and greater variation.
Let the old climate (solid curve) have a mean value of 14o C (that is 57.2o F) with a standard deviation of 10o C .
Find z-scores for the data values of interest below using the formula: z-score = data value - meanstandard deviationdata value - meanstandard deviation
and then find the percentages requested using either a normal distribution table or a capable calculator.
Use one year = 365 days. Round all percents to the nearest tenth of a percent and all days to the nearest day.
a) What percent of days will be 34o C or higher? % (nearest tenth of a percent)
b) How many days out of a year would that be? (nearest day)
c) What percent of days will be -6o C or lower? % (nearest tenth of a percent)
Now let the new climate (dashed curve) have a mean value of 16o C (a higher average), with a standard deviation of 12o C (greater variation).
Find the new z-scores and the new percentages for those same temps:
e) What percent of days will be 34o C or higher? % (nearest tenth of a percent)
f) How many days out of a year would that be? (nearest day)
g) What percent of days will be -6o C or lower? % (nearest tenth of a percent)
h) How many days out of a year would that be? (nearest day)
Explain why there were more cold days even though the average temperature increased.:
Describing Data Written Assignment Score: 0/200/4 answered Progress saved Done 6 yo Question 4 0/8 pts 5 Details Suppose a new climate is heading toward both a higher average temperature and greater variation. Statistically represented here with the graph showing a higher mean and greater variation. Old climate New -15 -10 -5 5 10 15 20 25 30 35 40 45 Let the old climate (solid curve) have a mean value of 14C (that is 57.2F) with a standard deviation of 10C. data value - mean Find z-scores for the data values interest below using the formula: Z-score = standard deviation and then find the percentages requested using either a normal distribution table or a capable calculator. Use one year = 365 days. Round all percents to the nearest tenth of a percent and all days to the nearest day a) What percent of days will be 34C or higher? (nearest tenth of a percent) b) How many days out of a year would that be? (nearest day) b) How many days out of a year would that be? (nearest day! c) What percent of days will be -6 C or lower? (nearest tenth of a percent) Now let the new climate (dashed curve) have a mean value of 16C (a higher average), with a standard deviation of 12C (greater variation). Find the new z-scores and the new percentages for those same temps: % (nearest tenth of a e) What percent of days will be 34C or higher? percent) f) How many days out of a year would that be? (nearest day) g) What percent of days will be -6 C or lower? (nearest tenth of a percent) h) How many days out of a year would that be? (nearest day) Explain why there were more cold days even though the average temperature increased
Step by Step Solution
There are 3 Steps involved in it

Get step-by-step solutions from verified subject matter experts