Question: Suppose a random variable is normally distributed with mean and standard equal to the sample mean and sample standard deviation of MedInc. Also, suppose that
Suppose a random variable is normally distributed with mean and standard equal to the sample mean and sample standard deviation of MedInc. Also, suppose that the incomes of individuals in West Virginia are also normally distributed with the same mean and standard deviation. Suppose you randomly sample 100 West Virginians for a survey. Write down the interval that is expected to contain 95% of the incomes in your sample and show your work in the sheet titled "Question 3". 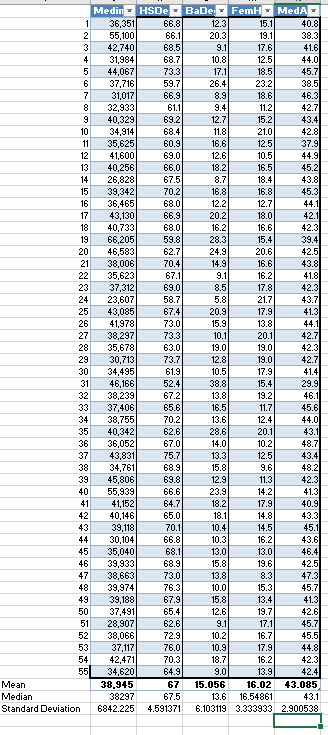
Medin - HSDe BaDe: - FemH - MedA 1 36,351 66.8 12.3 15.1 40.8 2 55,100 66.1 20.3 19.1 38.3 3 42,740 68.5 9.1 17.6 41.6 4 31,984 68.7 10.8 12.5 44.0 5 44,067 73.3 17.1 18.5 45.7 6 37,716 59.7 26.4 23.2 38.5 7 31,017 66.9 8.9 18.6 46.3 8 32,933 61.1 9.4 11.2 42.7 9 40,329 69.2 12.7 15.2 43.4 10 34,914 68.4 11.8 21.0 42.8 11 35,625 60.9 16.6 12.5 37.9 12 41,600 69.0 12.6 10.5 44.9 13 40,256 66.0 18.2 16.5 45.2 14 26,828 67.5 8.7 18.4 43.8 15 39,342 70.2 16.8 16.8 45.3 16 36,465 68.0 12.2 12.7 44.1 17 43,130 66.9 20.2 18.0 42.1 18 40,733) 68.0 16.2 16.6 42.3 19 66,205 59.8 28.3 15.4 39.4 20 46,583 62.7 24.9 20.6 42.5 21 38,006 70.4 14.9 16.6 43.8 22 35,623 67.1 9.1 16.2 41.8 23 37,312 69.0 8.5 17.8 42.3 24 23,607 58.7 5.8 21.7 43.7 25 43,085 67.4 20.9 17.9 41.3 26 41,978 73.0 15.9 13.8 44.1 27 38,297 73.3 10.1 20.1 42.7 28 35,678 63.0 19.0 19.0 42.3 29 30,713 73.7 12.8 19.0 42.7 30 34,495 61.9 10.5 17.9 41.4 31 46,166 52.4 38.8 15.4 29.9 32 38,239 67.2 13.8 19.2 46.1 33 37,406 65.6 16.5 11.7 45.6 34 38,755 70.2 13.6 12.4 44.0 35 40,342 62.6 28.6 20.1 43.1 36 36,052 67.0 14.0 10.2 48.7 37 75.7 13.3 12.5 43.4 38 34,761 68.9 15.8 9.6 48.2 39 45,806 69.8 12.9 11.3 42.3 40 55,939 66.6 23.9 14.2 41.3 41 41,152 64.7 18.2 17.9 40.9 42 40,146 65.0 18.1 14.8 43.3 43 39,118 70.1 14.5 45.1 44 30,104 66.8 10.3 16.2 43.6 45 35,040 68.1 13.0 46.4 46 39,933 68.9 15.8 19.6 42.5 47 38,663 73.0 13.8 8.3 47.3 48 39,974 76.3 10.0 15.3 45.7 49 39,188 67.9 15.8 41.3 50 37,491 65.4 19.7 42.6 51 28,907 9.11 17.1 45.7 52 38,066 10.2 16.7 45.5 53 37,117 76.0 10.9 17.9 44.8 54 42,471 70.31 18.7 16.2 42.3 55 34,620 64.9 9.0 13.9 42.4 Mean 38.945 67 15.056 16.02 13.085 Median 38297 67.5 13.6 16.54861 43.1 Standard Deviation 6842.225 4.591371 6.103119 3.333933 2.900538 43,831 10.4 13.0 13.4 12.6 62.6 72.9 1 Medin - HSDe BaDe: - FemH - MedA 1 36,351 66.8 12.3 15.1 40.8 2 55,100 66.1 20.3 19.1 38.3 3 42,740 68.5 9.1 17.6 41.6 4 31,984 68.7 10.8 12.5 44.0 5 44,067 73.3 17.1 18.5 45.7 6 37,716 59.7 26.4 23.2 38.5 7 31,017 66.9 8.9 18.6 46.3 8 32,933 61.1 9.4 11.2 42.7 9 40,329 69.2 12.7 15.2 43.4 10 34,914 68.4 11.8 21.0 42.8 11 35,625 60.9 16.6 12.5 37.9 12 41,600 69.0 12.6 10.5 44.9 13 40,256 66.0 18.2 16.5 45.2 14 26,828 67.5 8.7 18.4 43.8 15 39,342 70.2 16.8 16.8 45.3 16 36,465 68.0 12.2 12.7 44.1 17 43,130 66.9 20.2 18.0 42.1 18 40,733) 68.0 16.2 16.6 42.3 19 66,205 59.8 28.3 15.4 39.4 20 46,583 62.7 24.9 20.6 42.5 21 38,006 70.4 14.9 16.6 43.8 22 35,623 67.1 9.1 16.2 41.8 23 37,312 69.0 8.5 17.8 42.3 24 23,607 58.7 5.8 21.7 43.7 25 43,085 67.4 20.9 17.9 41.3 26 41,978 73.0 15.9 13.8 44.1 27 38,297 73.3 10.1 20.1 42.7 28 35,678 63.0 19.0 19.0 42.3 29 30,713 73.7 12.8 19.0 42.7 30 34,495 61.9 10.5 17.9 41.4 31 46,166 52.4 38.8 15.4 29.9 32 38,239 67.2 13.8 19.2 46.1 33 37,406 65.6 16.5 11.7 45.6 34 38,755 70.2 13.6 12.4 44.0 35 40,342 62.6 28.6 20.1 43.1 36 36,052 67.0 14.0 10.2 48.7 37 75.7 13.3 12.5 43.4 38 34,761 68.9 15.8 9.6 48.2 39 45,806 69.8 12.9 11.3 42.3 40 55,939 66.6 23.9 14.2 41.3 41 41,152 64.7 18.2 17.9 40.9 42 40,146 65.0 18.1 14.8 43.3 43 39,118 70.1 14.5 45.1 44 30,104 66.8 10.3 16.2 43.6 45 35,040 68.1 13.0 46.4 46 39,933 68.9 15.8 19.6 42.5 47 38,663 73.0 13.8 8.3 47.3 48 39,974 76.3 10.0 15.3 45.7 49 39,188 67.9 15.8 41.3 50 37,491 65.4 19.7 42.6 51 28,907 9.11 17.1 45.7 52 38,066 10.2 16.7 45.5 53 37,117 76.0 10.9 17.9 44.8 54 42,471 70.31 18.7 16.2 42.3 55 34,620 64.9 9.0 13.9 42.4 Mean 38.945 67 15.056 16.02 13.085 Median 38297 67.5 13.6 16.54861 43.1 Standard Deviation 6842.225 4.591371 6.103119 3.333933 2.900538 43,831 10.4 13.0 13.4 12.6 62.6 72.9 1


