

Question: Suppose a researcher is interested in a new method for increasing forced vital capacity (FVC) in asthmatic children. The following table represents the FVC for
Suppose a researcher is interested in a new method for increasing forced vital capacity (FVC) in asthmatic children. The following table represents the FVC for a group of children before and after the intervention is initiated.
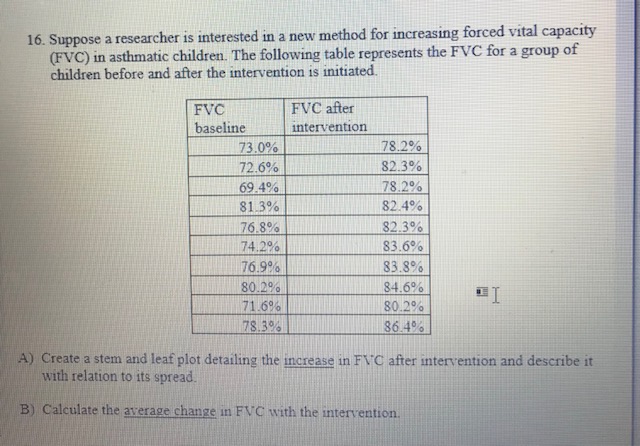
16. Suppose a researcher is interested in a new method for increasing forced vital capacity (FVC) in asthmatic children. The following table represents the FVC for a group of children before and after the intervention is initiated FVC FVC after baseline intervention 73.0% 78.2% 72.6% 82.3% 69.4% 78.2% 81 3% 82.4% 76.8% 82.3% 74.2% 83.6% 76.9% 83.8% 80.2% 84.6% 71.6% 80.2% ET 78.3% 86.4% A) Create a stem and leaf plot detailing the increase in FVC after intervention and describe it with relation to its spread. B) Calculate the average change in FVC with the intervention
Step by Step Solution
There are 3 Steps involved in it

Get step-by-step solutions from verified subject matter experts