

Question: Suppose data set 1 represents the amount of weight lost in two weeks for twenty randomly selected people following a low carbohydrate diet. Suppose
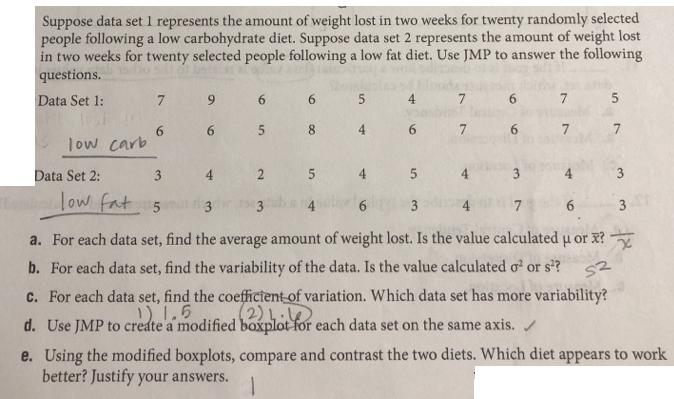
Suppose data set 1 represents the amount of weight lost in two weeks for twenty randomly selected people following a low carbohydrate diet. Suppose data set 2 represents the amount of weight lost in two weeks for twenty selected people following a low fat diet. Use JMP to answer the following questions. Data Set 1: TEST low carb. Data Set 2: 7 6 9 6 6 3 4 low fat 5 5 8 7 4 6 7 6 6 7 7 P 2 5 4 5 3 6 a. For each data set, find the average amount of weight lost. Is the value calculated u or x? b. For each data set, find the variability of the data. Is the value calculated o or s? 52 5 c. For each data set, find the coefficient of variation. Which data set has more variability? d. Use JMP to create a modified boxplot for each data set on the same axis. 7 3 e. Using the modified boxplots, compare and contrast the two diets. Which diet appears to work better? Justify your answers.
Step by Step Solution
3.47 Rating (150 Votes )
There are 3 Steps involved in it
Solution Boxplot for ... View full answer

Get step-by-step solutions from verified subject matter experts