

Question: Suppose > is the standard normal variable. Draw the normal curve for each of the following probability statements to visualize the required area. Report answers
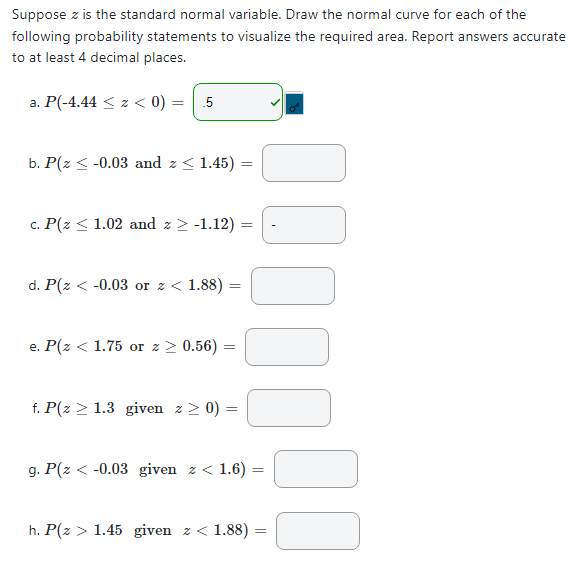
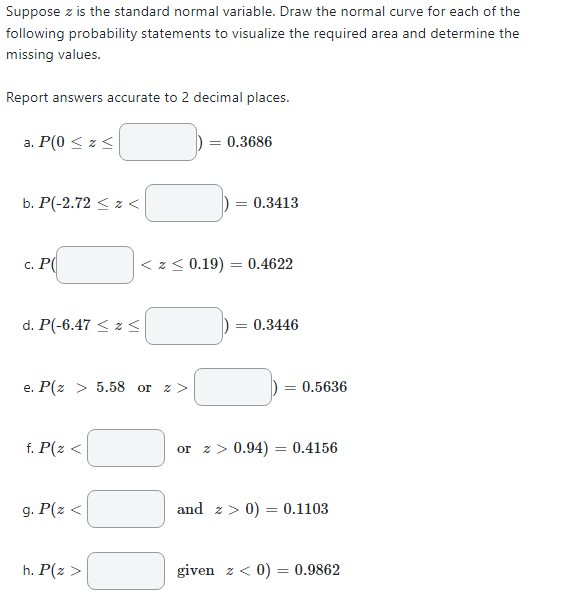
Suppose > is the standard normal variable. Draw the normal curve for each of the following probability statements to visualize the required area. Report answers accurate to at least 4 decimal places. a. P(-4.44 -1.12) = d. P(2 > 0.56) = f. P(z > 1.3 given > > 0) = g. P(z 1.45 given 2
Step by Step Solution
There are 3 Steps involved in it
1 Expert Approved Answer
Step: 1 Unlock

Question Has Been Solved by an Expert!
Get step-by-step solutions from verified subject matter experts
Step: 2 Unlock
Step: 3 Unlock