

Question: suppose selected financial data target and Wal-mart for 2017 are presented here Suppose selected financial data of Target and Wal-Mart for 2017 are presented here
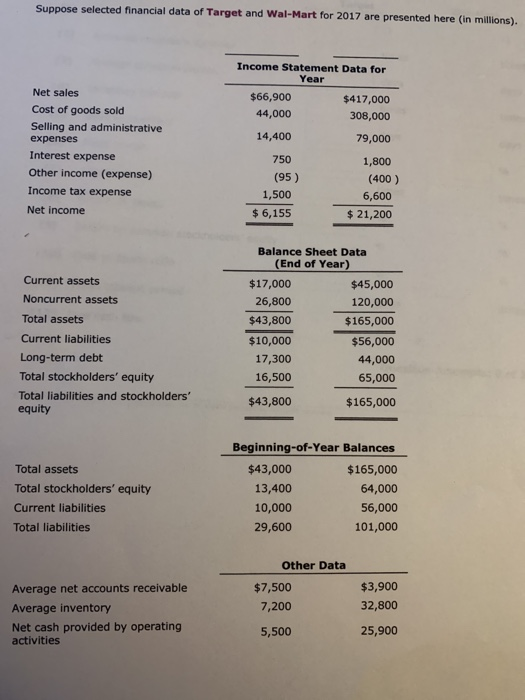
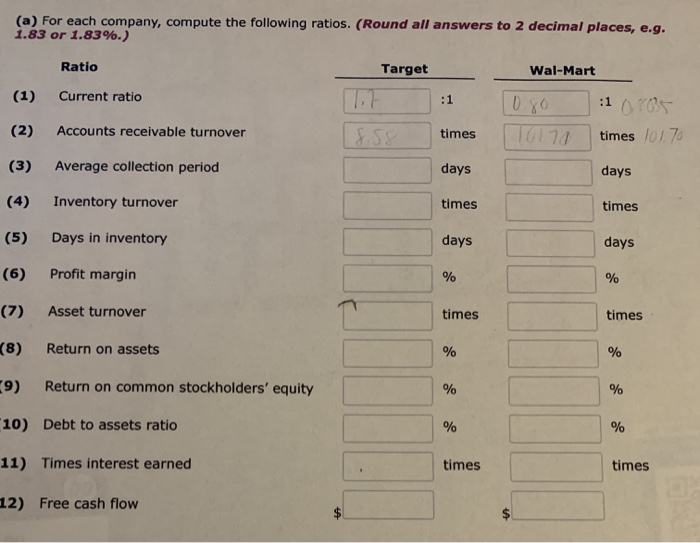
Suppose selected financial data of Target and Wal-Mart for 2017 are presented here (in millions). Income Statement Data for Year $66,900 44,000 14,400 $417,000 308,000 79,000 Net sales Cost of goods sold Selling and administrative expenses Interest expense Other income (expense) Income tax expense Net income 750 (95) 1,500 $ 6,155 1,800 (400) 6,600 $ 21,200 Current assets Noncurrent assets Total assets Current liabilities Long-term debt Total stockholders' equity Total liabilities and stockholders' equity Balance Sheet Data (End of Year) $17,000 $45,000 26,800 120,000 $43,800 $165,000 $10,000 $56,000 17,300 44,000 16,500 65,000 $43,800 $165,000 Total assets Total stockholders' equity Current liabilities Total liabilities Beginning-of-Year Balances $43,000 $165,000 13,400 64,000 10,000 56,000 29,600 101,000 Other Data $7,500 7,200 $3,900 32,800 Average net accounts receivable Average inventory Net cash provided by operating activities 5,500 25,900 (a) For each company, compute the following ratios. (Round all answers to 2 decimal places, e.g. 1.83 or 1.83%.) Ratio Target Wal-Mart (1) Current ratio 10.801 101.74 oros times 101.70 (2) Accounts receivable turnover times Average collection period days days Inventory turnover times times (5) Days in inventory days days Profit margin % (7) Asset turnover times times (8) Return on assets 9) Return on common stockholders' equity 10) Debt to assets ratio 11) Times interest earned times times L2) Free cash flow
Step by Step Solution
There are 3 Steps involved in it

Get step-by-step solutions from verified subject matter experts