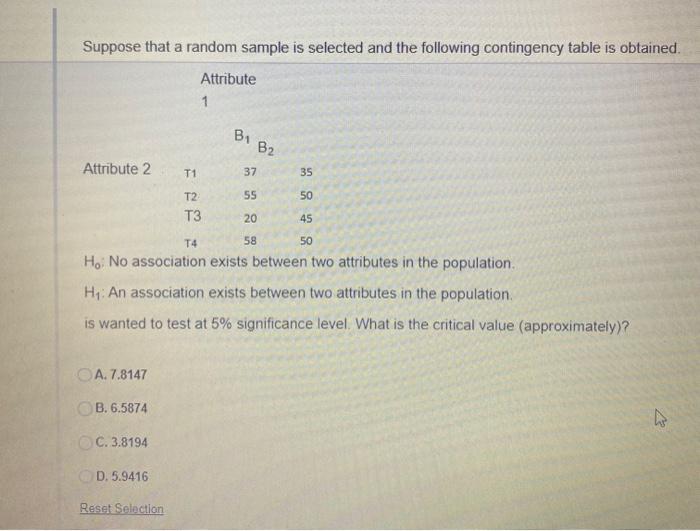
Question: Suppose that a random sample is selected and the following contingency table is obtained. Attribute 1 B1 B2 Attribute 2 T1 37 35 T2 55

Suppose that a random sample is selected and the
Suppose that a random sample is selected and the following contingency table is obtained. Attribute 1 B1 B2 Attribute 2 T1 37 35 T2 55 50 T3 20 45 T4 58 50 H. No association exists between two attributes in the population. Hy: An association exists between two attributes in the population is wanted to test at 5% significance level. What is the critical value (approximately)? A. 7.8147 B. 6.5874 w C. 3.8194 D. 5.9416 Reset Selection Part 1 of 1 - Question 10 of 16 10 Points Suppose that a random sample of 14 observations is selected from a normally distributed population. The sample mean and the sample standard deviation are calculated as 219.594 and 11.864, respectively. Obtain 95% confidence interval for the population mean (consider two-sided confidence interval). What are the lower and upper confidence limits, respectively? A. Approximately 214.8754 and Approximately 228.8746 B. Approximately 210.6547 and Approximately 228.5643 C. Approximately 213.5478 and Approximately 227.8532 D. Approximately 212.7439 and Approximately 226.4441 Reset Selection Part 1 of 1 Question 11 of 16 5 Points Suppose that a random sample of 45 observations is drawn from normally distributed population with the standard deviation of 5.854. The sample mean is calculated as 62.164. H: = 63.5 against H:

Step by Step Solution

There are 3 Steps involved in it

1 Expert Approved Answer
Step: 1 Unlock blur-text-image
Question Has Been Solved by an Expert!

Get step-by-step solutions from verified subject matter experts

Step: 2 Unlock
Step: 3 Unlock

Students Have Also Explored These Related General Management Questions!