

Question: Suppose that a researcher, using data on class size (CS) and average test scores from 94 third-grade classes, estimates the OLS regression A TestScore =
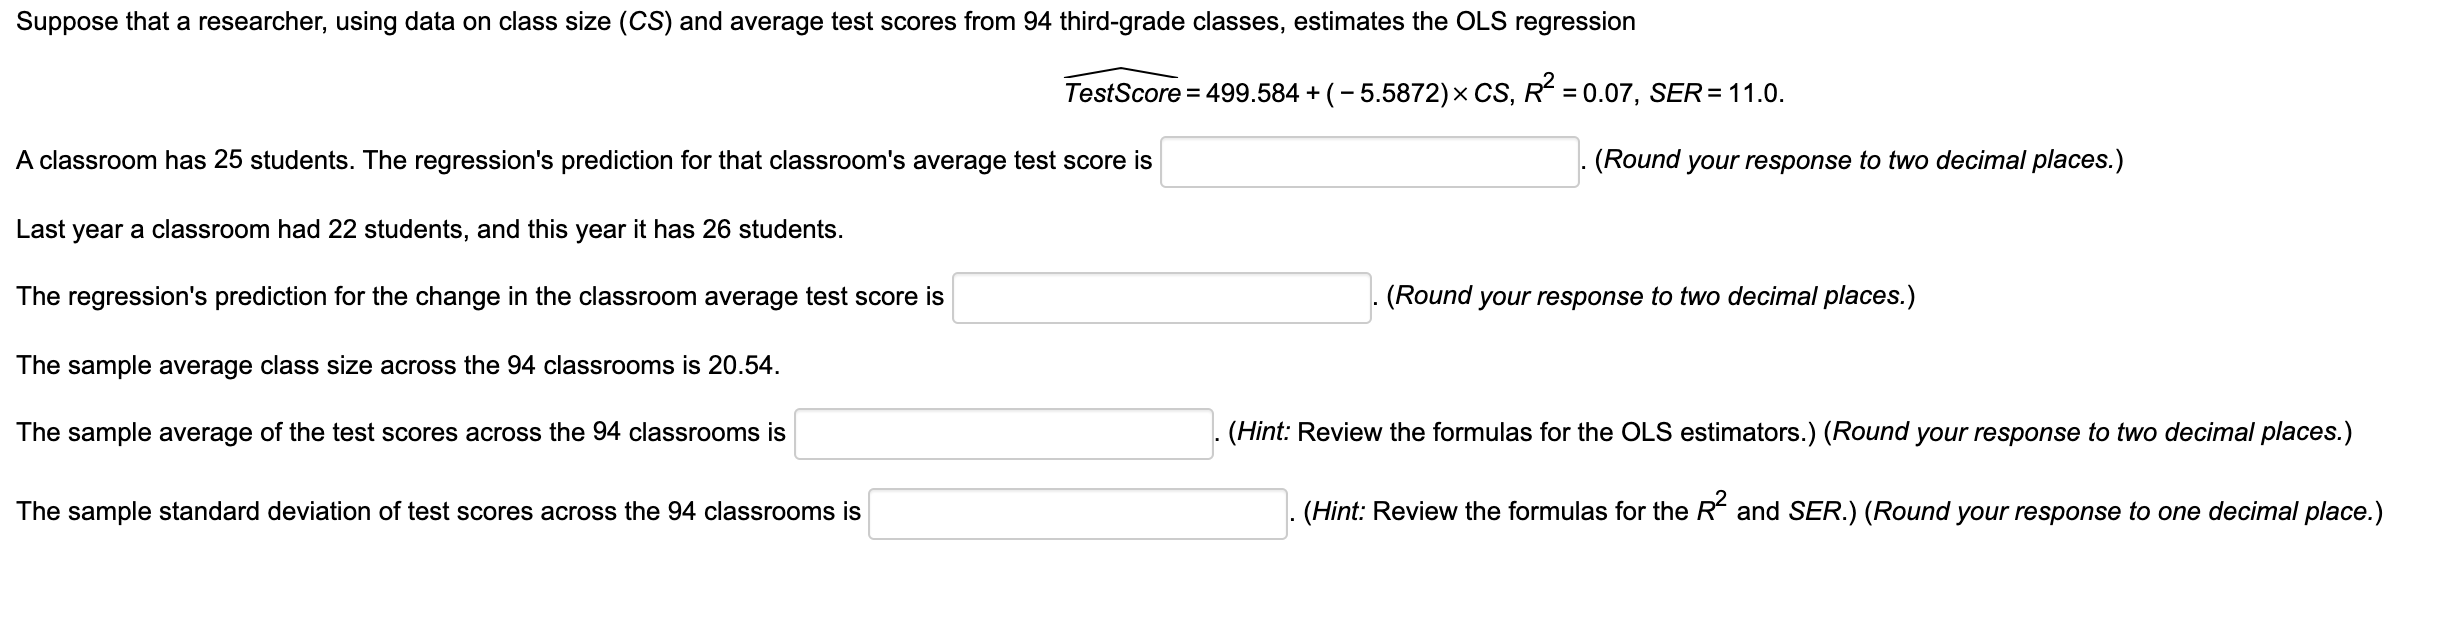
Suppose that a researcher, using data on class size (CS) and average test scores from 94 third-grade classes, estimates the OLS regression A TestScore = 499.584 + ( 5.5872) x CS, R2 = 0.07, SER = 11.0. A classroom has 25 students. The regression's prediction for that classroom's average test score is . (Round your response to two decimal places.) Last year a classroom had 22 students, and this year it has 26 students. The regression's prediction for the change in the classroom average test score is . (Round your response to two decimal places.) The sample average class size across the 94 classrooms is 20.54. The sample average of the test scores across the 94 classrooms is l '. (Hint: Review the formulas for the OLS estimators.) (Round your response to two decimal places.) The sample standard deviation of test scores across the 94 classrooms is l . (Hint: Review the formulas for the R2 and SER.) (Round your response to one decimal place.)
Step by Step Solution
There are 3 Steps involved in it

Get step-by-step solutions from verified subject matter experts