

Question: Suppose that from historical simulation, you have obtained n = 500 loss scenarios, the following table contains the five worst loss scenarios and the
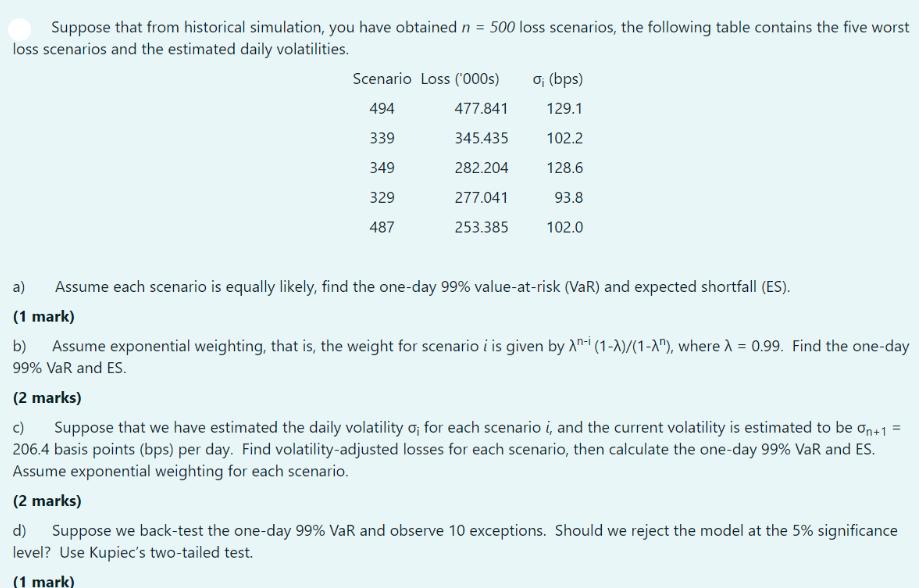
Suppose that from historical simulation, you have obtained n = 500 loss scenarios, the following table contains the five worst loss scenarios and the estimated daily volatilities. Scenario Loss ('000s) 494 477.841 339 345.435 349 282.204 329 277.041 487 253.385 ; (bps) 129.1 102.2 128.6 93.8 102.0 a) Assume each scenario is equally likely, find the one-day 99% value-at-risk (VaR) and expected shortfall (ES). (1 mark) b) Assume exponential weighting, that is, the weight for scenario i is given by An- (1-X)/(1-A"), where = 0.99. Find the one-day 99% VaR and ES. (2 marks) c) Suppose that we have estimated the daily volatility ; for each scenario i, and the current volatility is estimated to be an+1 = 206.4 basis points (bps) per day. Find volatility-adjusted losses for each scenario, then calculate the one-day 99% VaR and ES. Assume exponential weighting for each scenario. (2 marks) d) Suppose we back-test the one-day 99% VaR and observe 10 exceptions. Should we reject the model at the 5% significance level? Use Kupiec's two-tailed test. (1 mark)
Step by Step Solution
There are 3 Steps involved in it
a To calculate the oneday 99 ValueatRisk VaR and Expected Shortfall ES assuming each scenario is equally likely we can use the historical simulation approach To find VaR we need to sort the loss scena... View full answer

Get step-by-step solutions from verified subject matter experts