

Question: Suppose that Kent Co. has generated forecasts for the pound for four quarters and is comparing these forecasts to the realized values of the pound.
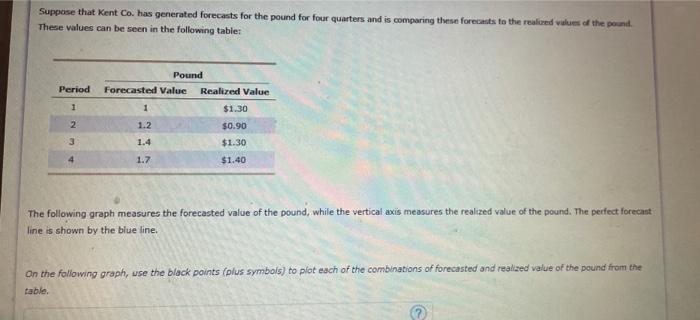
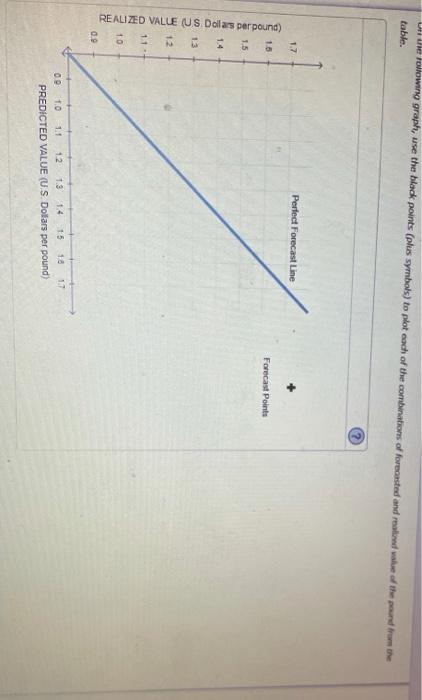
Suppose that Kent Co. has generated forecasts for the pound for four quarters and is comparing these forecasts to the realized values of the pound. These values can be seen in the following table: Pound Forecasted Value Realized Value Period 1 1 2 1.2 $1.30 $0.90 $1.30 1.4 4 1.7 $1.40 The following graph measures the forecasted value of the pound, while the vertical axis measures the realized value of the pound. The perfect forecast line is shown by the blue line. On the following graph, use the black points (plus symbols) to plot each of the combinations of forecasted and realized value of the pound from the table 2 U ure rolowing graph, use the black points (plus symbols) to plot each of the combinations of forecasted and real wale of the pound from the table 1.7 Perfect Forecast Line 16 Forecast Points 1.5 1.4 REALIZED VALLE US Dollas per pound) 1.3 12 1 1 + 10 0.0 00 1.0 1.1 12 13 15 18 17 PREDICTED VALUE (US Dollars per pound)
Step by Step Solution
There are 3 Steps involved in it

Get step-by-step solutions from verified subject matter experts