

Question: Suppose that Kent Co. is a US-based MNC that is evaluating its forecasts of the British pound. This MNC wishes to perform a graphical

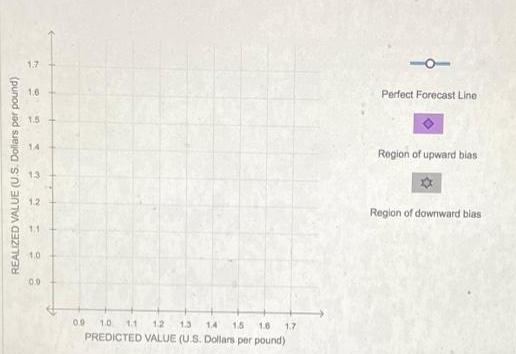
Suppose that Kent Co. is a US-based MNC that is evaluating its forecasts of the British pound. This MNC wishes to perform a graphical analysis as part of the evaluation. The following graph measures the forecasted value of the pound, while the vertical axis measures the realized value of the pound. On the following graph, use the blue line (circle symbols) to plot the perfect forecast line. Then, use the purple point (diamond symbol) to shade the region of the graph that corresponds to the region of upward blas. Finally, use the gray point (star symbol) to shade the area corresponding to the region of downward blas. 1.7 1.6 Perfect Forecast Line 1.5 1.4 Region of upward bias 13 1.2 Region of downward bias 1.1 1.0 09 10 11 12 13 1.4 15 10 1.7 PREDICTED VALUE (U.S. Dollars per pound) REALIZED VALUE (U.S. Doliars per pound)
Step by Step Solution
3.36 Rating (152 Votes )
There are 3 Steps involved in it
Graphical Evaluation of Forecast Performance REALIZED VALUE vs PREDICTEDVALUE 17 15 ... View full answer

Get step-by-step solutions from verified subject matter experts