

Question: Suppose that random variable A is uniformly distributed between 5 and 24. Draw a graph of the density function, and then use it to help
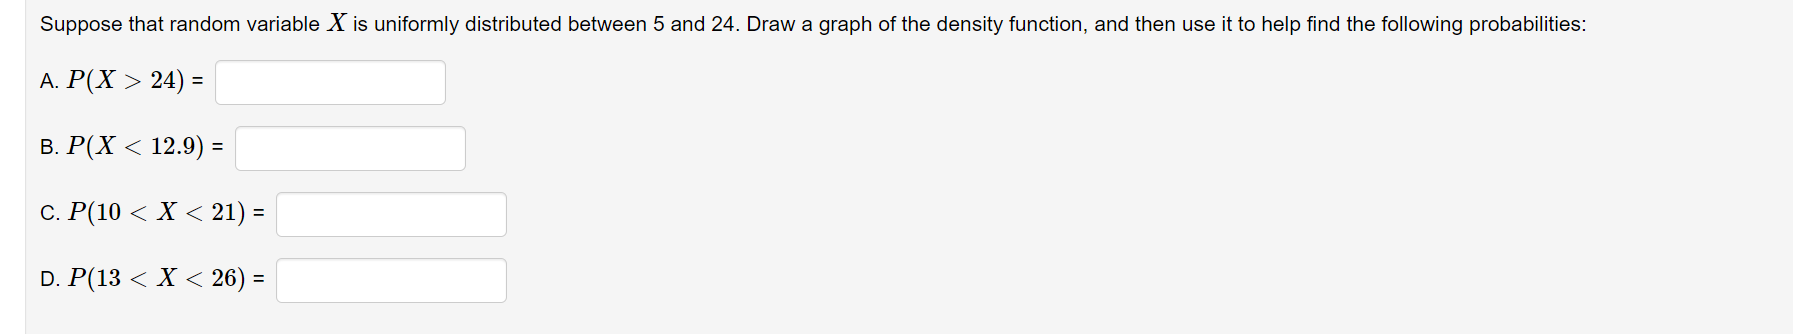
Suppose that random variable A is uniformly distributed between 5 and 24. Draw a graph of the density function, and then use it to help find the following probabilities: A. P(X > 24) = B. P(X
Step by Step Solution
There are 3 Steps involved in it
1 Expert Approved Answer
Step: 1 Unlock

Question Has Been Solved by an Expert!
Get step-by-step solutions from verified subject matter experts
Step: 2 Unlock
Step: 3 Unlock