

Question: Suppose that the average time spent per day with digital media several years ago was 3 hours and 41 minutes. For last year, a random

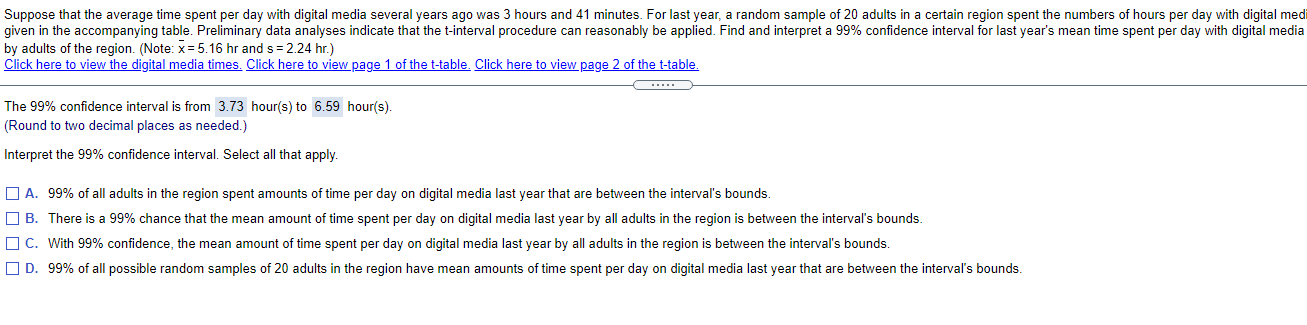
Suppose that the average time spent per day with digital media several years ago was 3 hours and 41 minutes. For last year, a random sample of 20 adults in a certain region spent the numbers of hours per day with digital med given in the accompanying table. Preliminary data analyses indicate that the t-interval procedure can reasonably be applied. Find and interpret a 99% confidence interval for last year's mean time spent per day with digital media by adults of the region. (Note: x = 5.16 hr and s = 2.24 hr.) Click here to view the digital media times. Click here to view page 1 of the t-table. Click here to view page 2 of the t-table. The 99% confidence interval is from 3.73 hour(s) to 6.59 hour(s). (Round to two decimal places as needed.) Interpret the 99% confidence interval. Select all that apply. O A. 99% of all adults in the region spent amounts of time per day on digital media last year that are between the interval's bounds. B. There is a 99% chance that the mean amount of time spent per day on digital media last year by all adults in the region is between the interval's bounds. [ C. With 99% confidence, the mean amount of time spent per day on digital media last year by all adults in the region is between the interval's bounds. OD. 99% of all possible random samples of 20 adults in the region have mean amounts of time spent per day on digital media last year that are between the interval's bounds
Step by Step Solution
There are 3 Steps involved in it

Get step-by-step solutions from verified subject matter experts