

Question: Suppose that the following information is known about a function f: the graph of its derivative, 3; : f'(a:), is given in the figure below.
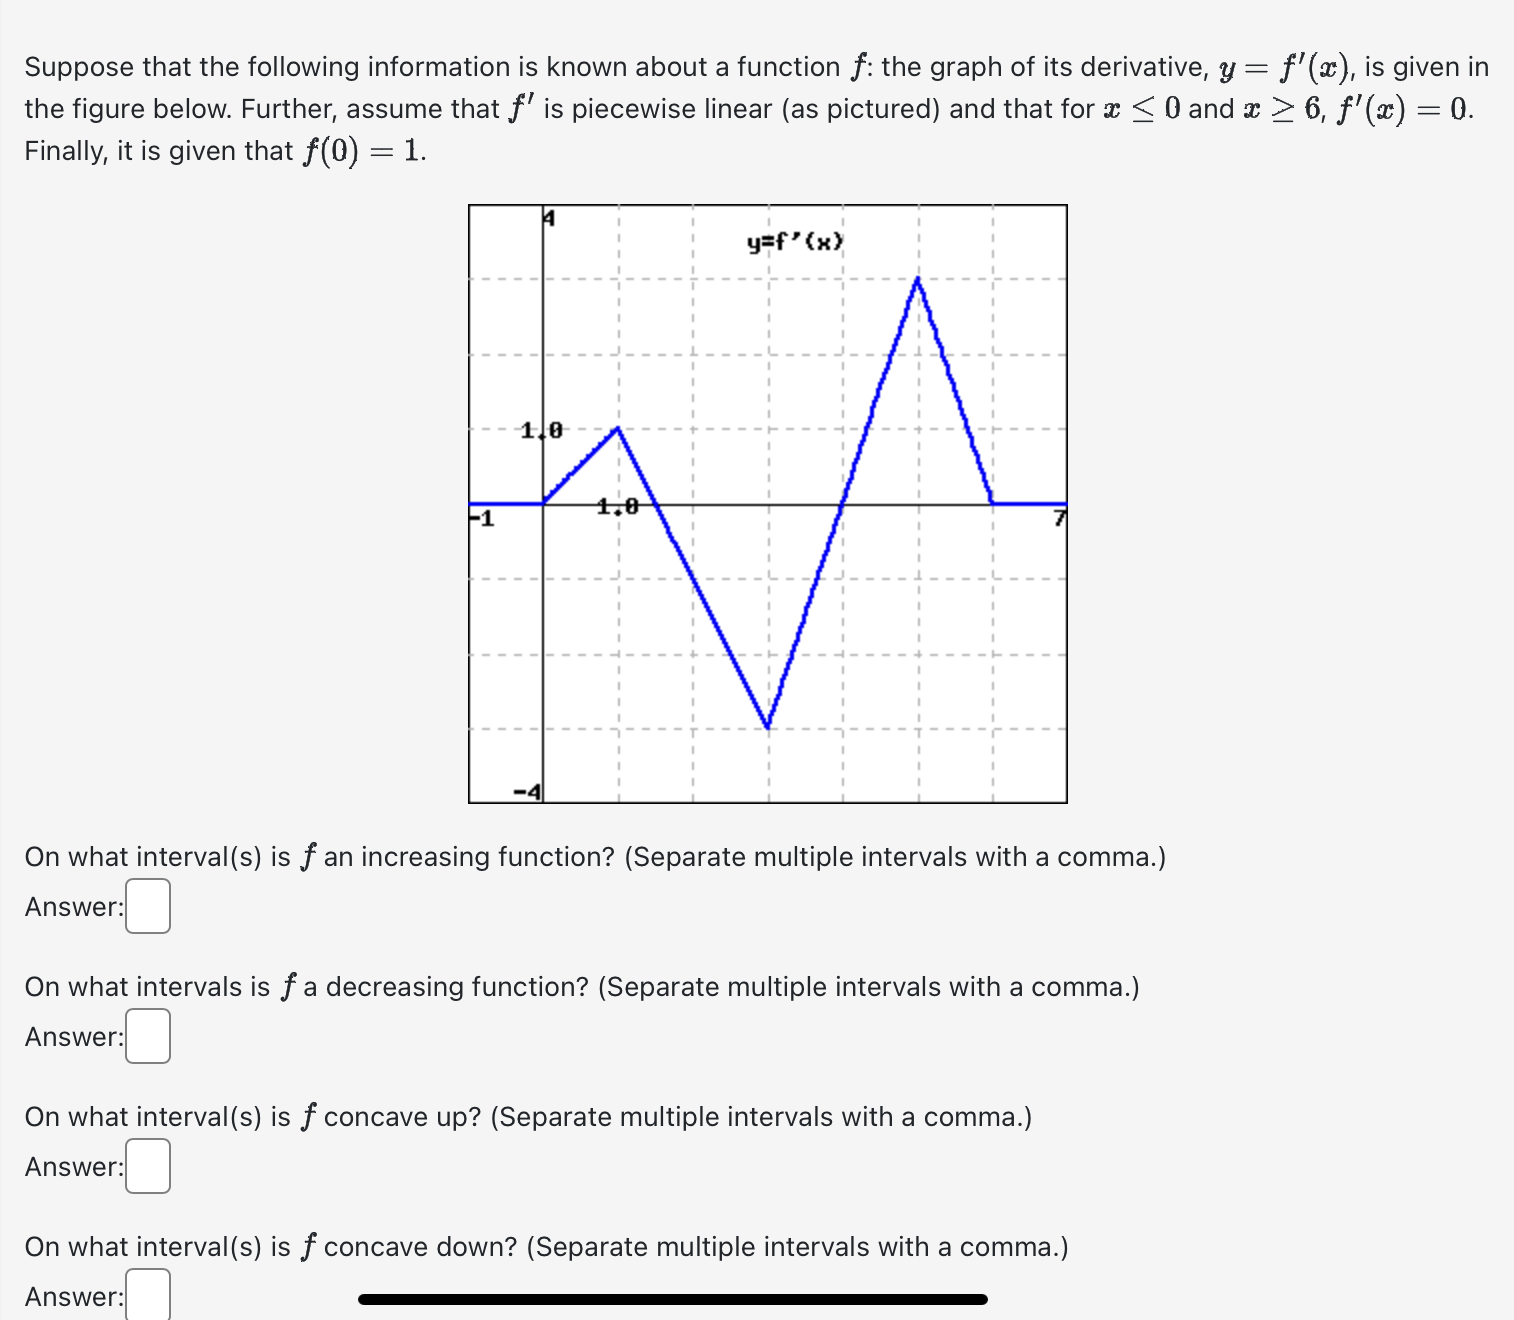
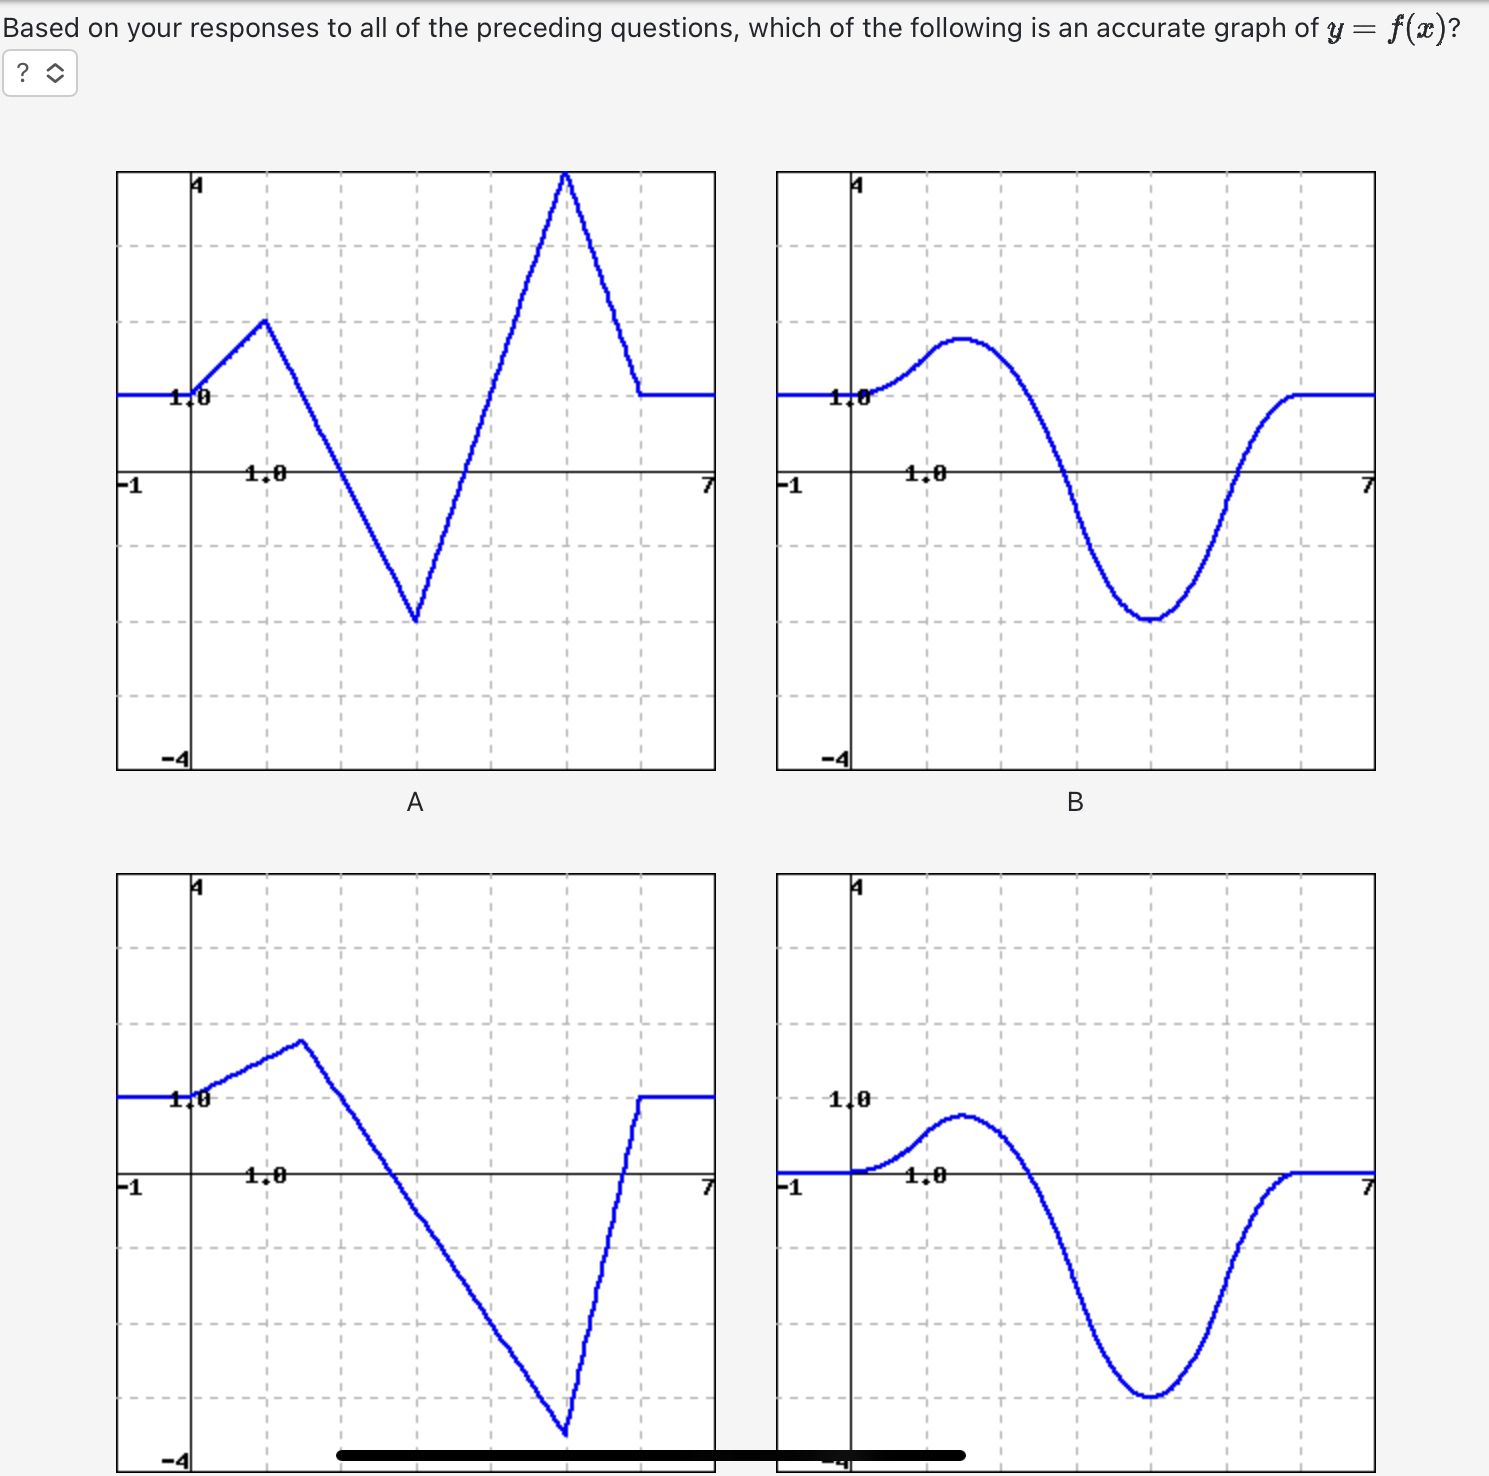
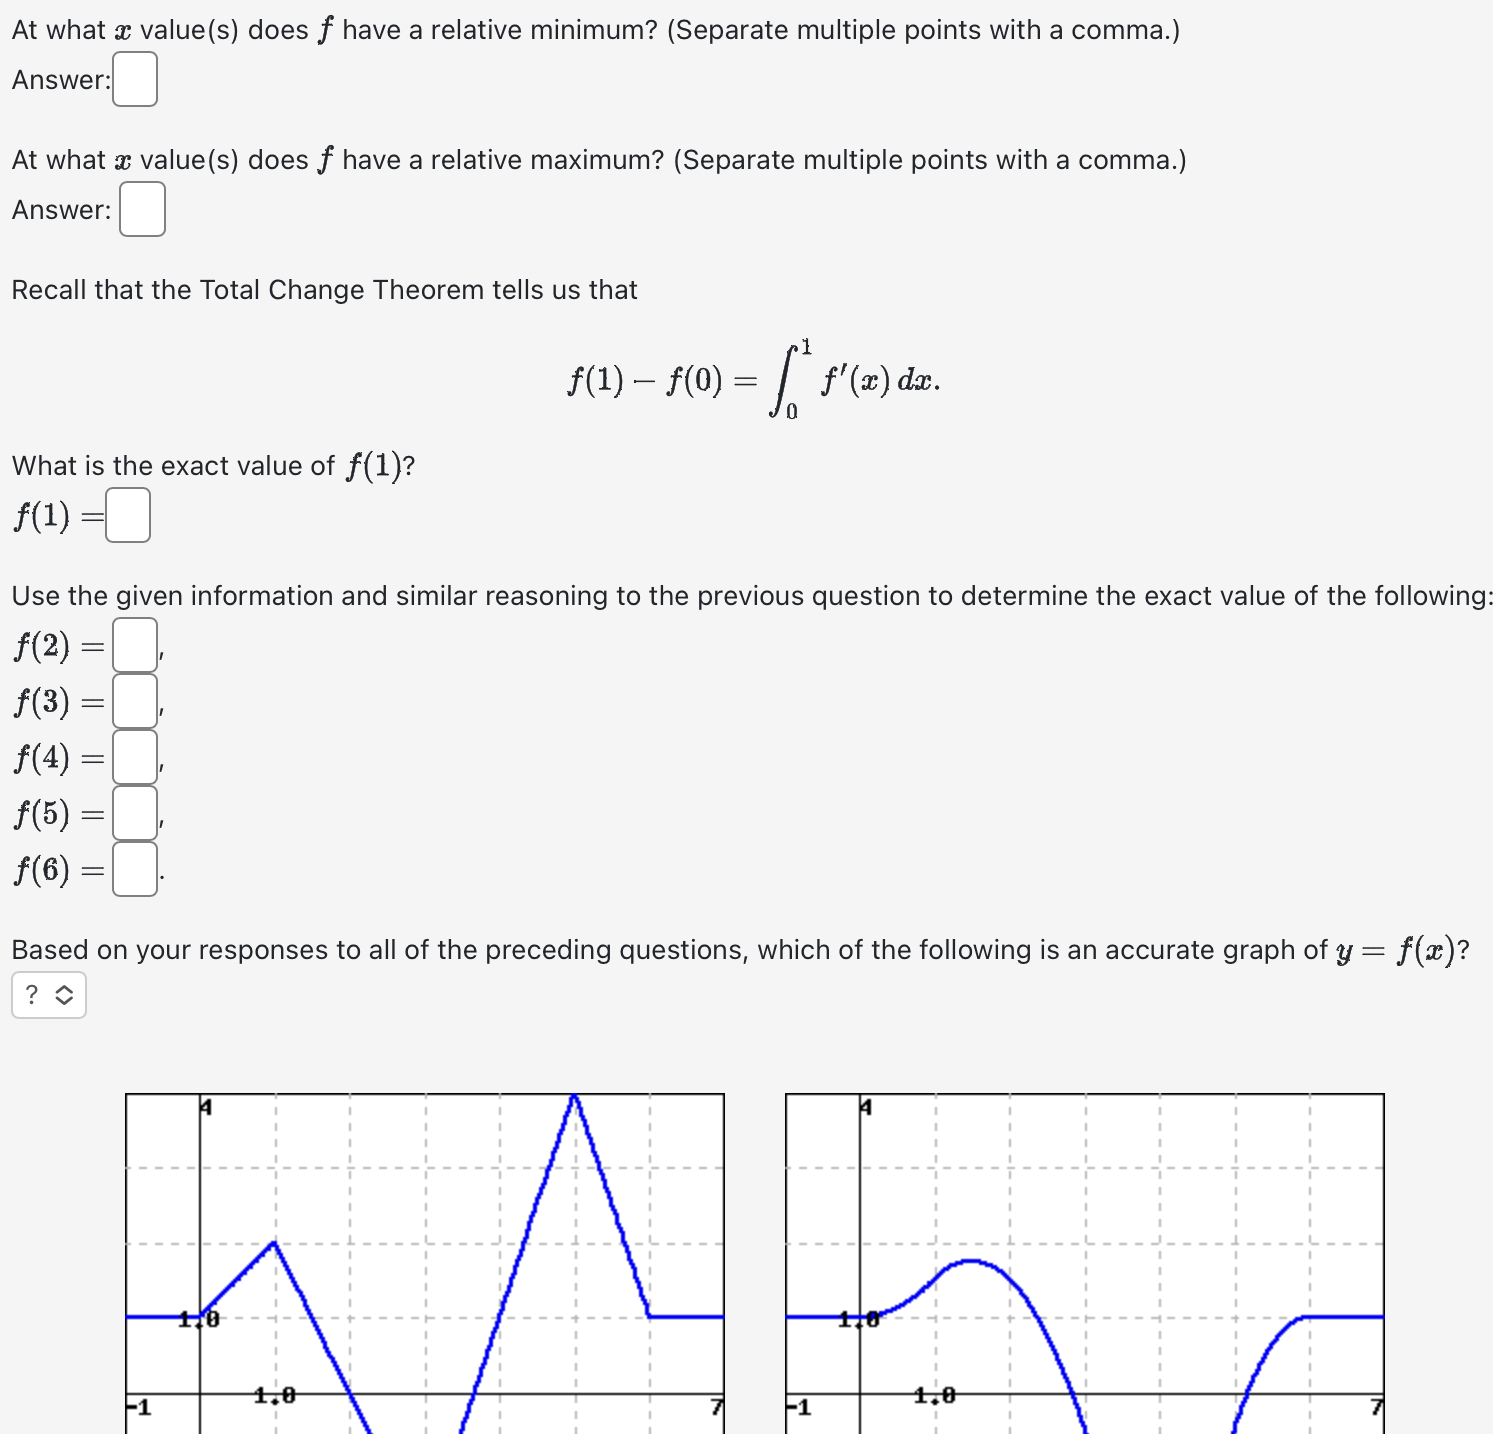
Suppose that the following information is known about a function f: the graph of its derivative, 3; : f'(a:), is given in the figure below. Further, assume that f' is piecewise linear (as pictured) and that for x S 0 and w 2 6, f'(a:) : 0. Finally, it is given that f({]) = 1. On what interval(s) is f an increasing function? (Separate multiple intervals with a comma.) Answer:D On what intervals is fa decreasing function? (Separate multiple intervals with a comma.) Answer:D On what interval(s) is f concave up? (Separate multiple intervals with a comma.) Answer:D On what interval(s) is f concave down? (Separate multiple intervals with a comma.) Answerz Based on your responses to all of the preceding questions, which of the following is an accurate graph of y = ag)? I) A V At what m value(s) does f have a relative minimum? (Separate multiple points with a comma.) AI'ISWBI'ZC] At what a; value(s) does f have a relative maximum? (Separate multiple points with a comma.) Answer: C] Recall that the Total Change Theorem tells us that 1 m) f(0) : f ed:- What is the exact value of l)? m) =C] Use the given information and similar reasoning to the previous question to determine the exact value of the following
Step by Step Solution
There are 3 Steps involved in it

Get step-by-step solutions from verified subject matter experts