Question: Suppose that the information in Problem 1 is revised as shown in the table below where the demand level is composed of two states only
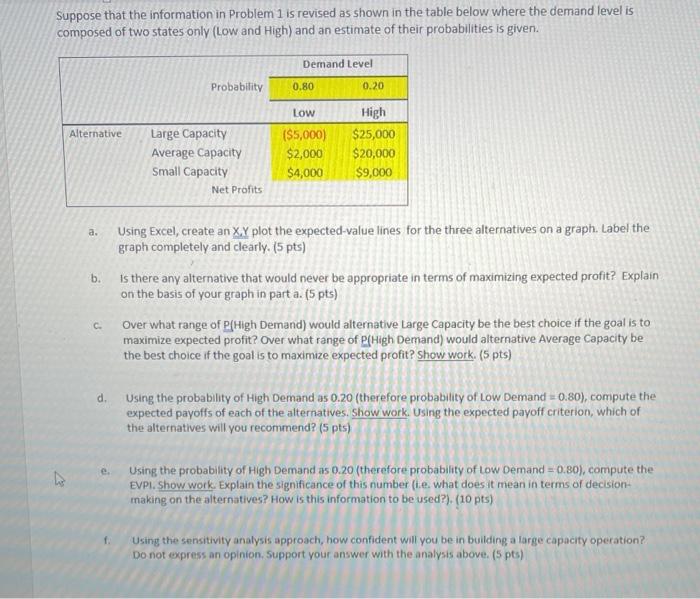
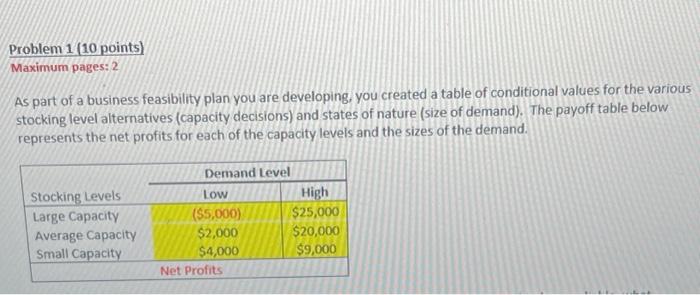
Suppose that the information in Problem 1 is revised as shown in the table below where the demand level is composed of two states only (Low and High) and an estimate of their probabilities is given. Demand Level Probability 0.80 0.20 Low Alternative Large Capacity Average Capacity Small Capacity Net Profits ($5,000) $2,000 $4,000 High $25,000 $20,000 $9,000 a. Using Excel, create an XY plot the expected value lines for the three alternatives on a graph. Label the graph completely and clearly. (5 pts) b. Is there any alternative that would never be appropriate in terms of maximizing expected profit? Explain on the basis of your graph in part a. (5 pts) Over what range of P[High Demand) would alternative Large Capacity be the best choice if the goal is to maximize expected profit? Over what range of e(High Demand) would alternative Average Capacity be the best choice if the goal is to maximize expected profit? Show work. (5 pts) C d. Using the probability of High Demand as 0.20 (therefore probability of Low Demand = 0.80), compute the expected payoffs of each of the alternatives. Show work. Using the expected payoff criterion, which of the alternatives will you recommend? (5 pts) e. Using the probability of High Demand as 0.20 (therefore probability of Low Demand = 0.80), compute the EVPI. Show work. Explain the significance of this number (ie what does it mean in terms of decision- making on the alternatives? How is this information to be used?). (10 pts) Using the sensitivity analysis approach, how confident will you be in building a large capacity operation? Do not express an opinion, Support your answer with the analysis above. (5 pts) Problem 1 (10 points) Maximum pages: 2 As part of a business feasibility plan you are developing, you created a table of conditional values for the various stocking level alternatives (capacity decisions) and states of nature size of demand). The payoff table below represents the net profits for each of the capacity levels and the sizes of the demand. Stocking Levels Large Capacity Average Capacity Small Capacity Demand Level Low High ($5,000) $25,000 $2,000 $20,000 $4,000 $9,000 Net Profits