

Suppose that we are in a (nightmarish) world where there are two products: (i) skateboards and...
Fantastic news! We've Found the answer you've been seeking!
Question:
Transcribed Image Text:
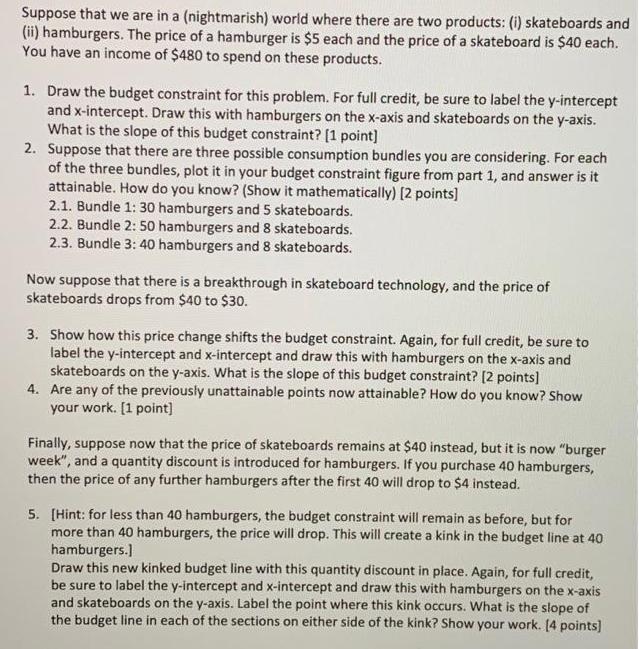
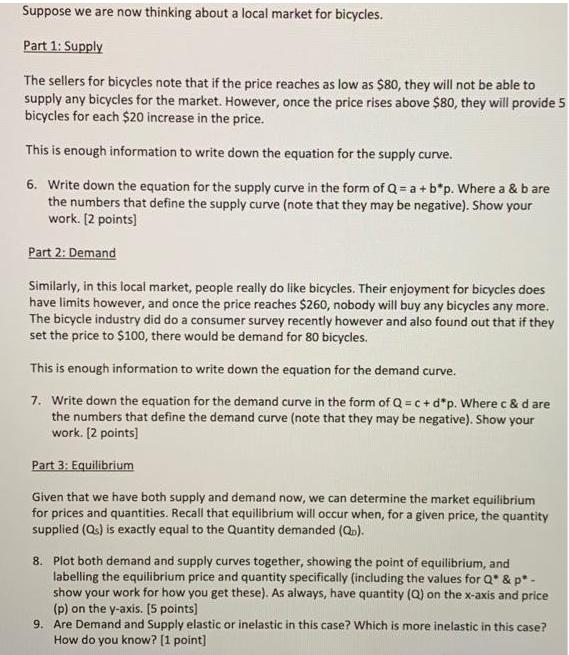
Suppose that we are in a (nightmarish) world where there are two products: (i) skateboards and (ii) hamburgers. The price of a hamburger is $5 each and the price of a skateboard is $40 each. You have an income of $480 to spend on these products. 1. Draw the budget constraint for this problem. For full credit, be sure to label the y-intercept and x-intercept. Draw this with hamburgers on the x-axis and skateboards on the y-axis. What is the slope of this budget constraint? [1 point] 2. Suppose that there are three possible consumption bundles you are considering. For each of the three bundles, plot it in your budget constraint figure from part 1, and answer is it attainable. How do you know? (Show it mathematically) [2 points] 2.1. Bundle 1: 30 hamburgers and 5 skateboards. 2.2. Bundle 2: 50 hamburgers and 8 skateboards. 2.3. Bundle 3: 40 hamburgers and 8 skateboards. Now suppose that there is a breakthrough in skateboard technology, and the price of skateboards drops from $40 to $30. 3. Show how this price change shifts the budget constraint. Again, for full credit, be sure to label the y-intercept and x-intercept and draw this with hamburgers on the x-axis and skateboards on the y-axis. What is the slope of this budget constraint? [2 points] 4. Are any of the previously unattainable points now attainable? How do you know? Show your work. [1 point] Finally, suppose now that the price of skateboards remains at $40 instead, but it is now "burger week", and a quantity discount is introduced for hamburgers. If you purchase 40 hamburgers, then the price of any further hamburgers after the first 40 will drop to $4 instead. 5. [Hint: for less than 40 hamburgers, the budget constraint will remain as before, but for more than 40 hamburgers, the price will drop. This will create a kink in the budget line at 40 hamburgers.] Draw this new kinked budget line with this quantity discount in place. Again, for full credit, be sure to label the y-intercept and x-intercept and draw this with hamburgers on the x-axis and skateboards on the y-axis. Label the point where this kink occurs. What is the slope of the budget line in each of the sections on either side of the kink? Show your work. [4 points] Suppose we are now thinking about a local market for bicycles. Part 1: Supply The sellers for bicycles note that if the price reaches as low as $80, they will not be able to supply any bicycles for the market. However, once the price rises above $80, they will provide 5 bicycles for each $20 increase in the price. This is enough information to write down the equation for the supply curve. 6. Write down the equation for the supply curve in the form of Q = a + b*p. Where a & b are the numbers that define the supply curve (note that they may be negative). Show your work. [2 points] Part 2: Demand Similarly, in this local market, people really do like bicycles. Their enjoyment for bicycles does have limits however, and once the price reaches $260, nobody will buy any bicycles any more. The bicycle industry did do a consumer survey recently however and also found out that if they set the price to $100, there would be demand for 80 bicycles. This is enough information to write down the equation for the demand curve. 7. Write down the equation for the demand curve in the form of Q = c + d*p. Where c & d are the numbers that define the demand curve (note that they may be negative). Show your work. [2 points] Part 3: Equilibrium Given that we have both supply and demand now, we can determine the market equilibrium for prices and quantities. Recall that equilibrium will occur when, for a given price, the quantity supplied (Qs) is exactly equal to the Quantity demanded (Q.). 8. Plot both demand and supply curves together, showing the point of equilibrium, and labelling the equilibrium price and quantity specifically (including the values for Q* & p* - show your work for how you get these). As always, have quantity (Q) on the x-axis and price (p) on the y-axis. [5 points] 9. Are Demand and Supply elastic or inelastic in this case? Which is more inelastic in this case? How do you know? [1 point] Suppose that we are in a (nightmarish) world where there are two products: (i) skateboards and (ii) hamburgers. The price of a hamburger is $5 each and the price of a skateboard is $40 each. You have an income of $480 to spend on these products. 1. Draw the budget constraint for this problem. For full credit, be sure to label the y-intercept and x-intercept. Draw this with hamburgers on the x-axis and skateboards on the y-axis. What is the slope of this budget constraint? [1 point] 2. Suppose that there are three possible consumption bundles you are considering. For each of the three bundles, plot it in your budget constraint figure from part 1, and answer is it attainable. How do you know? (Show it mathematically) [2 points] 2.1. Bundle 1: 30 hamburgers and 5 skateboards. 2.2. Bundle 2: 50 hamburgers and 8 skateboards. 2.3. Bundle 3: 40 hamburgers and 8 skateboards. Now suppose that there is a breakthrough in skateboard technology, and the price of skateboards drops from $40 to $30. 3. Show how this price change shifts the budget constraint. Again, for full credit, be sure to label the y-intercept and x-intercept and draw this with hamburgers on the x-axis and skateboards on the y-axis. What is the slope of this budget constraint? [2 points] 4. Are any of the previously unattainable points now attainable? How do you know? Show your work. [1 point] Finally, suppose now that the price of skateboards remains at $40 instead, but it is now "burger week", and a quantity discount is introduced for hamburgers. If you purchase 40 hamburgers, then the price of any further hamburgers after the first 40 will drop to $4 instead. 5. [Hint: for less than 40 hamburgers, the budget constraint will remain as before, but for more than 40 hamburgers, the price will drop. This will create a kink in the budget line at 40 hamburgers.] Draw this new kinked budget line with this quantity discount in place. Again, for full credit, be sure to label the y-intercept and x-intercept and draw this with hamburgers on the x-axis and skateboards on the y-axis. Label the point where this kink occurs. What is the slope of the budget line in each of the sections on either side of the kink? Show your work. [4 points] Suppose we are now thinking about a local market for bicycles. Part 1: Supply The sellers for bicycles note that if the price reaches as low as $80, they will not be able to supply any bicycles for the market. However, once the price rises above $80, they will provide 5 bicycles for each $20 increase in the price. This is enough information to write down the equation for the supply curve. 6. Write down the equation for the supply curve in the form of Q = a + b*p. Where a & b are the numbers that define the supply curve (note that they may be negative). Show your work. [2 points] Part 2: Demand Similarly, in this local market, people really do like bicycles. Their enjoyment for bicycles does have limits however, and once the price reaches $260, nobody will buy any bicycles any more. The bicycle industry did do a consumer survey recently however and also found out that if they set the price to $100, there would be demand for 80 bicycles. This is enough information to write down the equation for the demand curve. 7. Write down the equation for the demand curve in the form of Q = c + d*p. Where c & d are the numbers that define the demand curve (note that they may be negative). Show your work. [2 points] Part 3: Equilibrium Given that we have both supply and demand now, we can determine the market equilibrium for prices and quantities. Recall that equilibrium will occur when, for a given price, the quantity supplied (Qs) is exactly equal to the Quantity demanded (Q.). 8. Plot both demand and supply curves together, showing the point of equilibrium, and labelling the equilibrium price and quantity specifically (including the values for Q* & p* - show your work for how you get these). As always, have quantity (Q) on the x-axis and price (p) on the y-axis. [5 points] 9. Are Demand and Supply elastic or inelastic in this case? Which is more inelastic in this case? How do you know? [1 point]
Expert Answer:
Answer rating: 100% (QA)
1 Slope Px Py 540 18 2 Bundle 1 is attainable Bundle 2 ... View the full answer

Related Book For 

Quantitative Methods for Business
ISBN: 978-0324651751
11th Edition
Authors: David Anderson, Dennis Sweeney, Thomas Williams, Jeffrey cam
Posted Date:
Students also viewed these accounting questions
-
You have an income of $40 to spend on two commodities. Commodity 1 costs $10 per unit, and commodity 2 costs $5 per unit. (a) Write down your budget equation. 10x1 + 5x2 = 40. (b) If you spent all...
-
Suppose that we are testing H0: 1 = 2 versus H1: 1 2 and we plan to use equal sample sizes from the two populations. Both populations are assumed to be normal with unknown but equal...
-
Suppose that we are in a condition of "stuck" prices so that the price of nails will not go above or below $2/kg. Further suppose that nail factories have been built on a business plan designed to...
-
In 1987, British skier Graham Wilkie achieved a speed of v = 211 km/h going downhill. Assuming that he reached the maximum speed at the end of the hill and then continued on the horizontal surface,...
-
At a price of $5 the profit-maximizing output for a perfectly competitive firm is 1,000 units per year. If the average total cost is $3 per unit, what will be the firms profit? If the average total...
-
The Youngs modulus (see P2.40) of muscle fiber is approximately 2.80 10 7 Pa. A muscle fiber 3.25 cm in length and 0.125 cm in diameter is suspended with a mass M hanging at its end. Calculate the...
-
Refer to Exercise 5. a. Is the multiple regression equation useful for prediction? Explain. Use the = 0.05 level. b. Is the multiple regression equation useful for prediction? Explain. Use the =...
-
The Rago Corporation had the following stock outstanding from 2009 through 2012: Preferred stock: $100 par value, 8 percent cumulative, 5,000 shares authorized, issued, and outstanding Common stock:...
-
A 123456 1 Price 8. Given the data below, what is the volume weighted average quoted spread for my trades? D Volume TradeTim EventTim Offer 9 Bid Buyer Seller buyerID sellerID 20 20.4 50 9:44:45 907...
-
John has created an incredibly successful wine operation in the Northeast. All 5 are in a separate S-Corporation with all the stock owned by the parent Company Petosa Vineyards Inc, also an...
-
A rectangular garden of area 320 square feet is to be surrounded on three sides by a brick wall costing $10 per foot and on one side by a fence costing $6 per foot. Find the dimensions of the garden...
-
Which of the following is always included in an annual report but never in a quarterly report? a. Balance sheet. b. Income statement. c. Management's discussion and analysis. d. Auditor's report.
-
What is the most important feature of a driving point FRF?
-
Which of the following would increase the net profit margin ratio in the current year? a. Increase the amount of research and development in the last month of the year. b. Decrease the amount of...
-
A balance run using a trial weight placed at a 6-inch radius has called for a final weight of 210 g. The final weight is to be welded to the face of the fan at a radius of 18 inches using a -inch...
-
Which of the following describes a time-series analysis of your academic performance? a. Counting the number of A's on your transcript. b. Comparing the number of A's you received this year to the...
-
After the end of the most recent drought, California homeowners began to consider alternatives to maintaining and watering grass lawns in front of their homes. One of the alternatives for grass lawns...
-
For all of the following words, if you move the first letter to the end of the word, and then spell the result backwards, you will get the original word: banana dresser grammar potato revive uneven...
-
Consider a binomial experiment with n = 10 and p = 0.10. Use the binomial tables (Appendix B) to answer parts (a) through (d). a. Find f (0). b. Find f (2). c. Find P(x 2). d. Find P(x 1). e. Find...
-
All-Star Bat Manufacturing, Inc., supplies baseball bats to major and minor league baseball teams. After an initial order in January, demand over the six-month baseball season is approximately...
-
In the original Gorman Construction Company problem, we found the shortest distance from the office (node 1) to the construction site located at node 6. Because some of the roads are highways and...
-
After closing its accounts at May 31, 2008, Hueske Electric Company had the following account balances: Prepare Hueske's postclosing trial balance at May 31, 2008. List accounts in proper order, as...
-
Supplies has a $6,000 unadjusted balance on your trial balance. At year-end you count supplies of $2,000. What adjustment will appear on your work sheet? a. Supplies. 4,000 Supplies Expense.. 4,000...
-
Which columns of the work sheet show net income? a. Trial Balance b. Adjustments c. Income Statement d. Both b and c

Study smarter with the SolutionInn App