

Question: Suppose that we will randomly select a sample of n = 113 elements from a population and that we will compute the sample proportion of
Suppose that we will randomly select a sample ofn= 113 elements from a population and that we will compute the sample proportion
of these elements that fall into a category of interest. If the true population proportionpequals .8:
(a)Describe the shape of the sampling distribution of
. Why can we validly describe the shape? SEE IMAGE BELOW
(b)Find the mean and the standard deviation of the sampling distribution of
.(Round the answers to 2 decimal places.)
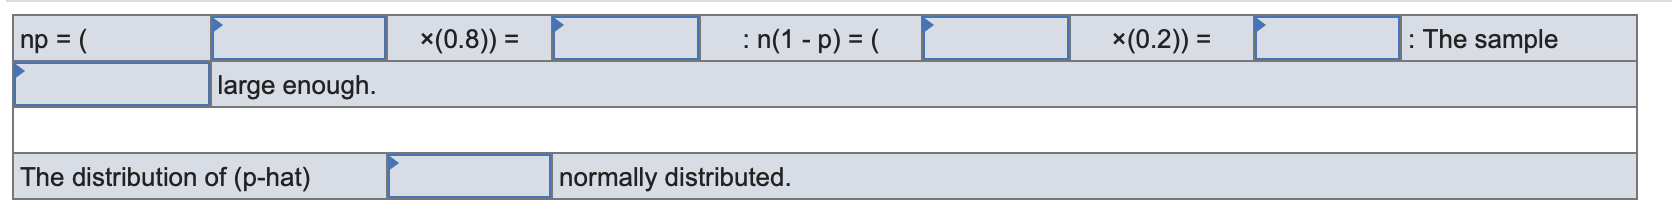
np = ( x(0.8)) = : n(1 - p) = ( *(0.2)) = : The sample large enough. The distribution of (p-hat) normally distributed
Step by Step Solution
There are 3 Steps involved in it
1 Expert Approved Answer
Step: 1 Unlock

Question Has Been Solved by an Expert!
Get step-by-step solutions from verified subject matter experts
Step: 2 Unlock
Step: 3 Unlock